Products
Grafana Cloud
Monitor, analyze, and act faster with AI-powered observability.
LGTM+ Stack
Key Capabilities
Observability Solutions
Open Source
Community resources
Dashboard templates
Try out and share prebuilt visualizations
Prometheus exporters
Get your metrics into Prometheus quickly
end-to-end solutions
Opinionated solutions that help you get there easier and faster
monitor infrastructure
Out-of-the-box KPIs, dashboards, and alerts for observability
visualize any data
Instantly connect all your data sources to Grafana
Learn
Community and events
Resources
Help build the future of open source observability software Open positions
Check out the open source projects we support Downloads
Grafana Cloud
Monitor, analyze, and act faster with AI-powered observability.
Observability Solutions
The actually useful free plan
10k series Prometheus metrics
50GB logs, 50GB traces, 50GB profiles
500VUh k6 testing
20+ Enterprise data source plugins
100+ pre-built solutions
3 active AI users
end-to-end solutions
Opinionated solutions that help you get there easier and faster
visualize any data
Instantly connect all your data sources to Grafana
Observability works best as a progression. 
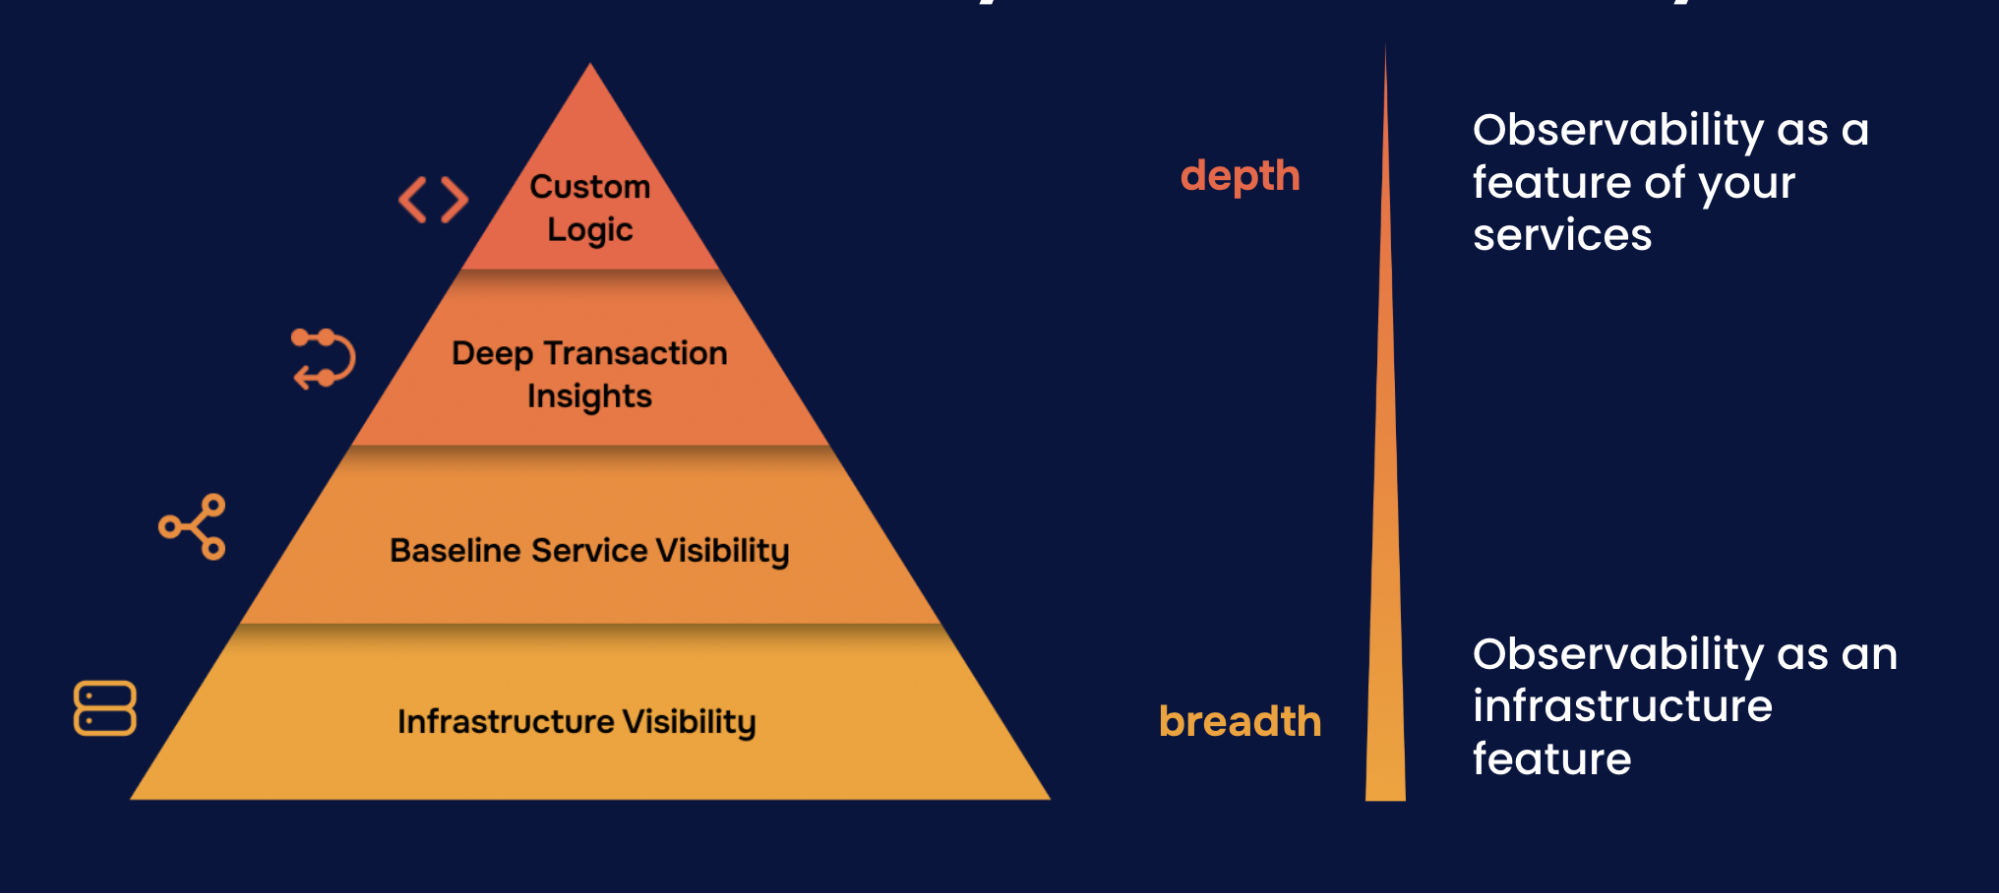
Each level builds on the previous, though teams sometimes need to work on multiple levels at once.
Each level provides context for the next.
| Dependency | Why |
|---|---|
| Level 2 requires Level 1 | You can’t debug applications without seeing the infrastructure they run on |
| Level 3 requires Level 2 | You can’t trace requests without knowing which service is causing problems |
| Level 4 requires Level 3 | You can’t add custom instrumentation without understanding where to instrument |
| Level | Focus | Key question |
|---|---|---|
| Level 1 | Infrastructure | “Is my infrastructure healthy?” |
| Level 2 | Services | “Which service is the problem?” |
| Level 3 | Transactions | “Why is this specific request slow?” |
| Level 4 | Application logic | “What’s happening in my code?” |
This pyramid is the most important concept in the entire course. It’s going to change how you think about observability.
Here’s why it matters. Teams sometimes get excited about distributed tracing, jump straight into implementing it, and then struggle to make sense of any of it. Why? Because they skipped the foundation. They couldn’t tell if their servers were healthy, so how could they possibly debug why a request was slow?
Observability works like a pyramid. You need each level to support the one above it. Level 1 is your foundation, providing visibility into basic infrastructure health. Level 2 asks which service is causing problems. Level 3 digs into specific requests. And Level 4 is about your unique application logic.
The magic happens when you recognize this as a prerequisite chain. You can’t effectively debug application issues if you can’t see the infrastructure those applications run on. So if you’re just getting started, resist the temptation to skip ahead. Build the foundation first.
