Slide 2 of 5

Your progress

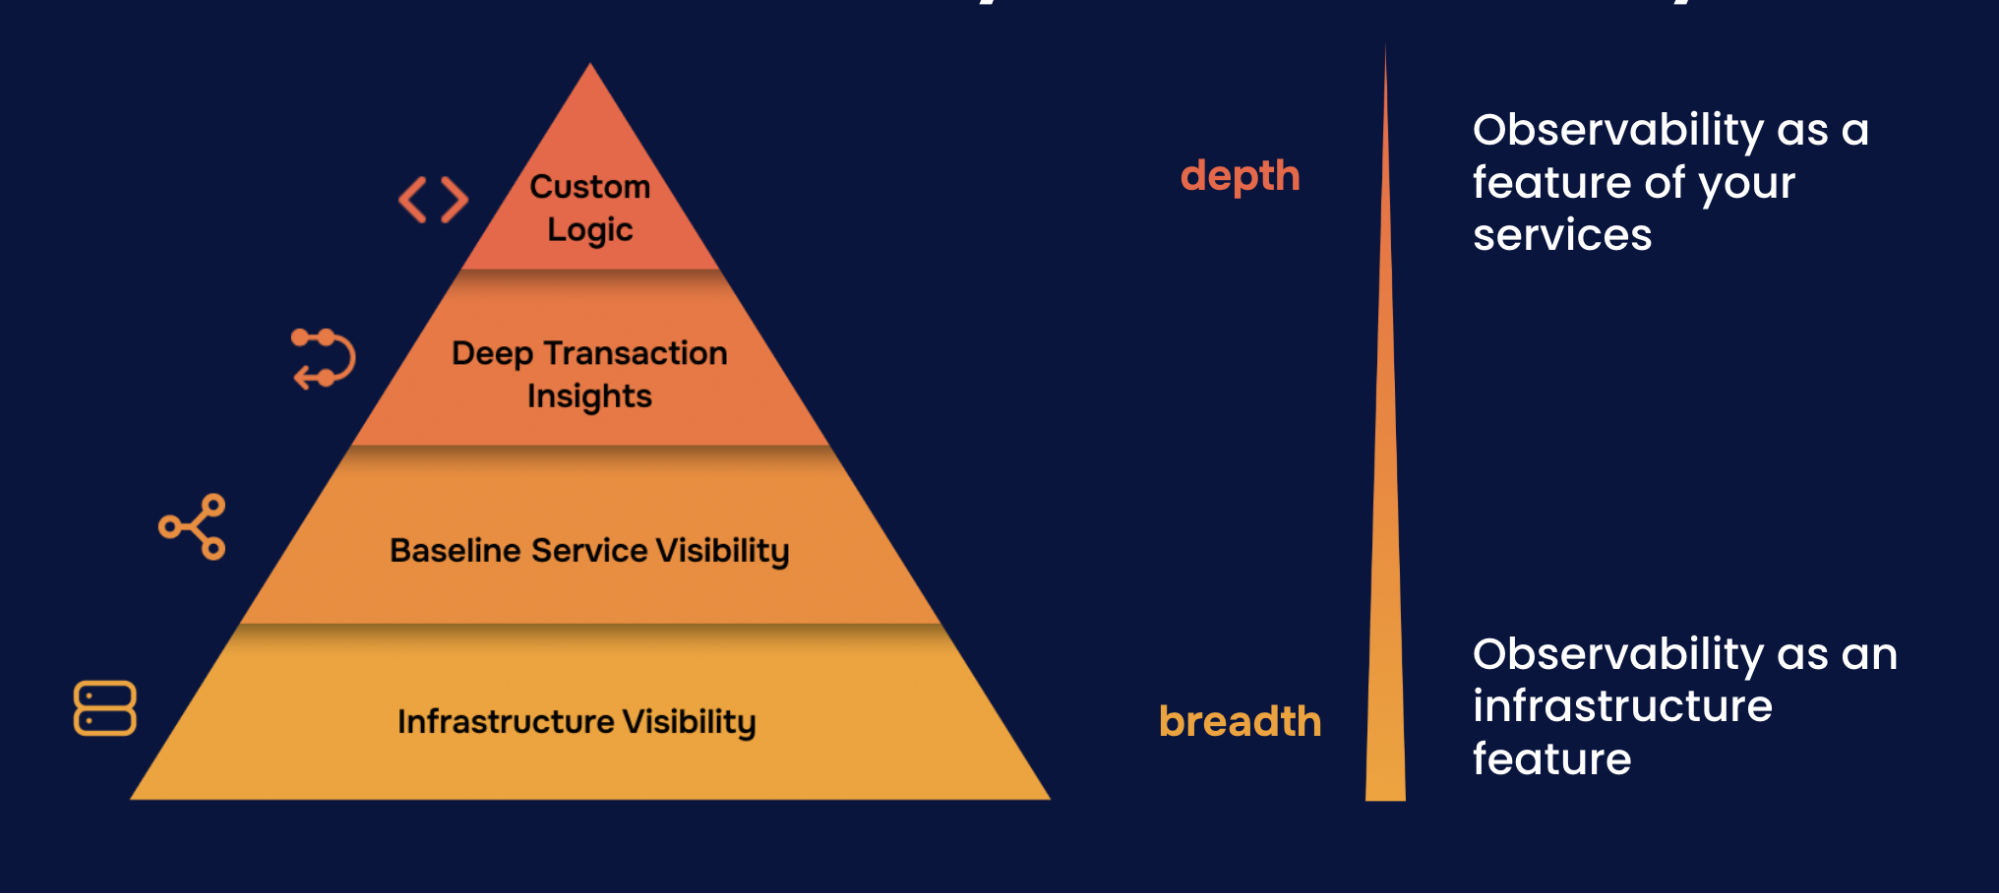
You’ve built Level 1 capabilities: Infrastructure visibility

Hierarchy of Observability Needs

Data sources expand your visibility

You can now query: “What’s happening in my connected systems?”

  • Data source connected to Grafana
  • Queries returning data
  • Ready to build dashboards

Continue building your foundation:

  • Add more data sources: Connect additional databases, APIs, cloud services
  • Deploy integrations: Get pre-built dashboards and alerts for common systems
  • Build dashboards: Visualize your data with custom panels

Introduction to integrations

Send data from external collectors

Introduction to Cloud Provider Observability

Script

Let’s step back and see where you are in your observability journey. Remember the hierarchy of observability needs? It’s a pyramid with four levels. Level 1 is infrastructure visibility. Can you see basic infrastructure health? Level 2 is service visibility. Which service is causing problems? Level 3 is transaction insights. Why is this specific request slow? And Level 4 is custom instrumentation. What’s happening in your code?

By connecting a data source, you’ve strengthened your Level 1 foundation. Data sources let you query existing systems, whether it’s a Prometheus server you’re already running, a cloud provider’s metrics, or even a JSON API. You’re bringing more data into Grafana, which means more visibility.

Data sources complement integrations nicely. Integrations give you pre-built dashboards and pre-configured alerts. Data sources give you flexibility to connect anything, and you can still create alerts using the same alerting engine. The difference is pre-configured versus create-your-own. Together, they help you build comprehensive infrastructure visibility.

Here are some courses that can help you continue building out your observability foundation.