Observability builds in layers
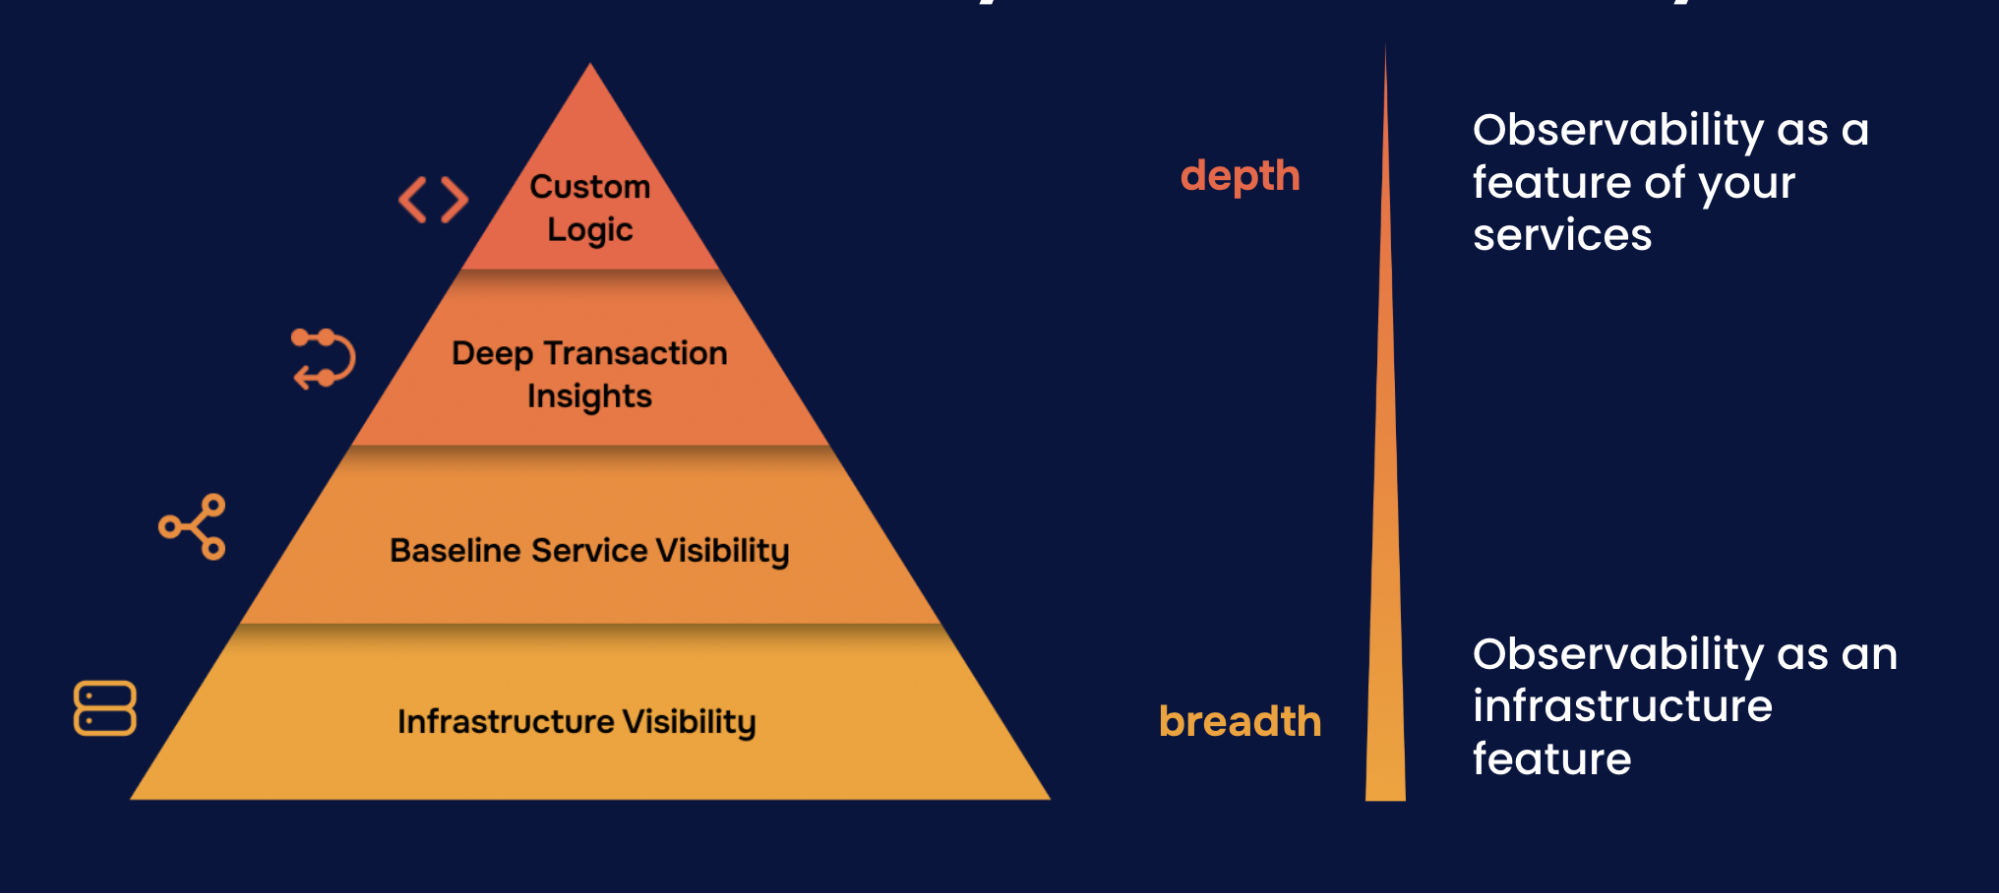
Key takeaway
Cloud provider observability gives you Level 1 visibility into your AWS, Azure, and GCP infrastructure.
You can’t troubleshoot services if you don’t know your cloud is healthy. Cloud provider observability builds that foundation.