Important: This documentation is about an older version. It's relevant only to the release noted, many of the features and functions have been updated or replaced. Please view the current version.
Using OpenTSDB in Grafana
Grafana ships with advanced support for OpenTSDB. This topic explains options, variables, querying, and other options specific to the OpenTSDB data source. Refer to Add a data source for instructions on how to add a data source to Grafana. Only users with the organization admin role can add data sources.
OpenTSDB settings
To access OpenTSDB settings, hover your mouse over the Configuration (gear) icon, then click Data Sources, and then click the OpenTSDB data source.
Query editor
Open a graph in edit mode by click the title. Query editor will differ if the data source has version <=2.1 or = 2.2. In the former version, only tags can be used to query OpenTSDB. But in the latter version, filters as well as tags can be used to query opentsdb. Fill Policy is also introduced in OpenTSDB 2.2.
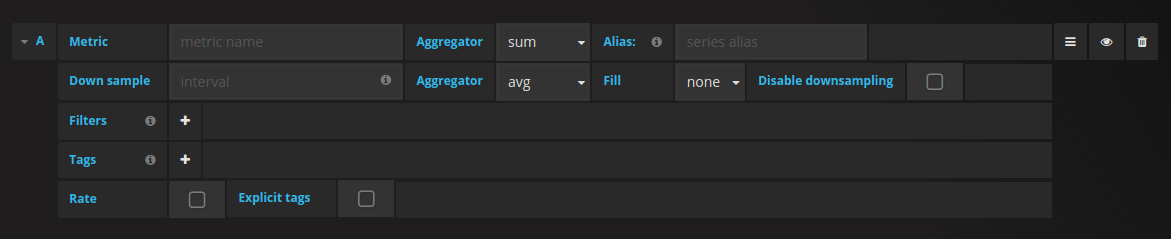
Note: While using OpenTSDB 2.2 data source, make sure you use either Filters or Tags as they are mutually exclusive. If used together, might give you weird results.
Auto complete suggestions
As soon as you start typing metric names, tag names and tag values , you should see highlighted auto complete suggestions for them. The autocomplete only works if the OpenTSDB suggest API is enabled.
Templating queries
Instead of hard-coding things like server, application and sensor name in your metric queries you can use variables in their place. Variables are shown as dropdown select boxes at the top of the dashboard. These dropdowns make it easy to change the data being displayed in your dashboard.
Check out the Templating documentation for an introduction to the templating feature and the different types of template variables.
Query variable
Grafana’s OpenTSDB data source supports template variable queries. This means you can create template variables that fetch the values from OpenTSDB. For example, metric names, tag names, or tag values.
When using OpenTSDB with a template variable of query type you can use following syntax for lookup.
If you do not see template variables being populated in Preview of values section, you need to enable
tsd.core.meta.enable_realtime_ts in the OpenTSDB server settings. Also, to populate metadata of
the existing time series data in OpenTSDB, you need to run tsdb uid metasync on the OpenTSDB server.
Nested templating
One template variable can be used to filter tag values for another template variable. First parameter is the metric name, second parameter is the tag key for which you need to find tag values, and after that all other dependent template variables. Some examples are mentioned below to make nested template queries work successfully.
For details on OpenTSDB metric queries, check out the official OpenTSDB documentation
Configure the data source with provisioning
It’s now possible to configure data sources using config files with Grafana’s provisioning system. You can read more about how it works and all the settings you can set for data sources on the provisioning docs page
Here are some provisioning examples for this data source.
apiVersion: 1

datasources:
  - name: OpenTsdb
    type: opentsdb
    access: proxy
    url: http://localhost:4242
    jsonData:
      tsdbResolution: 1
      tsdbVersion: 1

