Important: This documentation is about an older version. It's relevant only to the release noted, many of the features and functions have been updated or replaced. Please view the current version.
Dashboard overview
A dashboard is a set of one or more panels organized and arranged into one or more rows. Grafana ships with a variety of Panels. Grafana makes it easy to construct the right queries, and customize the display properties so that you can create the perfect dashboard for your need. Each panel can interact with data from any configured Grafana Data Source (currently Graphite, Prometheus, Elasticsearch, InfluxDB, OpenTSDB, MySQL, PostgreSQL, Microsoft SQL Server and AWS Cloudwatch).
Dashboard UI
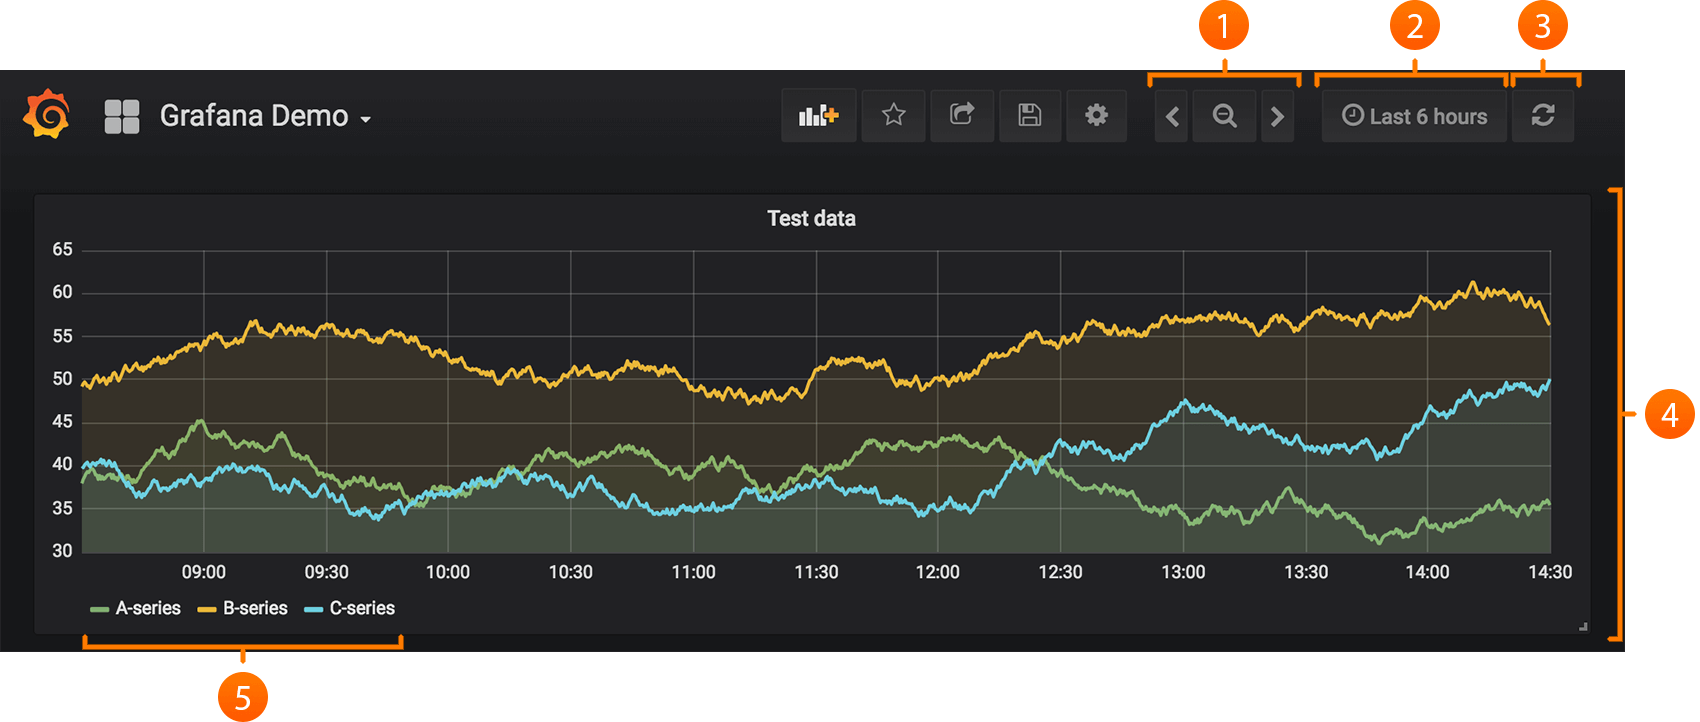
- Zoom out time range
- Time picker dropdown. Here you can access relative time range options, auto refresh options and set custom absolute time ranges.
- Manual refresh button. Will cause all panels to refresh (fetch new data).
- Dashboard panel. You edit panels by clicking the panel title.
- Graph legend. You can change series colors, y-axis and series visibility directly from the legend.
Dashboard header
Click the new Dashboard link on the right side of the Dashboard picker. You now have a blank Dashboard.
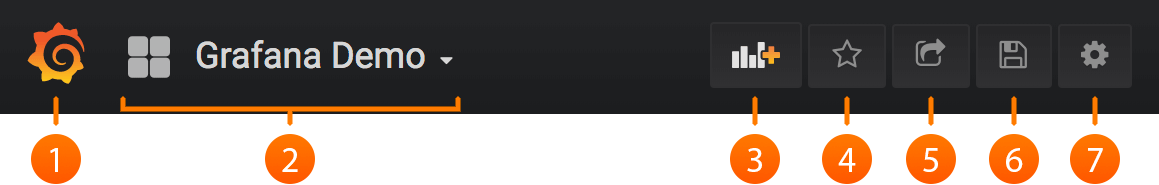
The image above shows you the top header for a Dashboard.
- Side menubar toggle: This toggles the side menu, allowing you to focus on the data presented in the dashboard. The side menu provides access to features unrelated to a Dashboard such as Users, Organizations, and Data Sources.
- Dashboard dropdown: This dropdown shows you which Dashboard you are currently viewing, and allows you to easily switch to a new Dashboard. From here you can also create a new Dashboard or folder, Import existing Dashboards, and manage Dashboard playlists.
- Add Panel: Adds a new panel to the current Dashboard
- Star Dashboard: Star (or unstar) the current Dashboard. Starred Dashboards will show up on your own Home Dashboard by default, and are a convenient way to mark Dashboards that you’re interested in.
- Share Dashboard: Share the current dashboard by creating a link or create a static Snapshot of it. Make sure the Dashboard is saved before sharing.
- Save dashboard: The current Dashboard will be saved with the current Dashboard name.
- Settings: Manage Dashboard settings and features such as Templating and Annotations.
Manage dashboards
The time period for the dashboard can be controlled by the Time range controls in the upper right of the dashboard.
Dashboards can use templating to make them more dynamic and interactive.
Dashboards can use annotations to display event data across panels. This can help correlate the time series data in the panel with other events.
Dashboards can be shared easily in a variety of ways.
Dashboards can be tagged, and the dashboard picker provides quick, searchable access to all dashboards in a particular organization.
Rows
A row is a logical divider within a dashboard. It is used to group panels together.
Rows are always 12 “units” wide. These units are automatically scaled dependent on the horizontal resolution of your browser. You can control the relative width of panels within a row by setting their specific width.
We use a unit abstraction so that Grafana looks great on all screens sizes.
Note: With MaxDataPoint functionality, Grafana can show you the perfect number of data points, regardless of resolution or time range.
Collapse a row by clicking on the row title. If you save a dashboard with a row collapsed, then it saves in that state and does not load those graphs until you expand the row.
Use the repeating rows functionality to dynamically create or remove entire rows, which can be filled with panels, based on the template variables selected.


