Important: This documentation is about an older version. It's relevant only to the release noted, many of the features and functions have been updated or replaced. Please view the current version.
What’s New in Grafana v3.1
Dashboard Export and Import
The export feature is now accessed from the share menu.
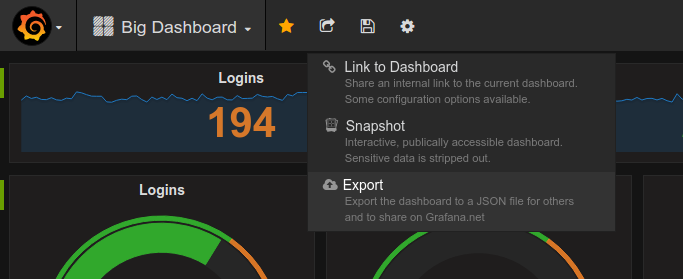
Dashboards exported from Grafana 3.1 are now more portable and easier for others to import than before. The export process extracts information data source types used by panels and adds these to a new inputs section in the dashboard json. So when you or another person tries to import the dashboard they will be asked to select data source and optional metric prefix options.
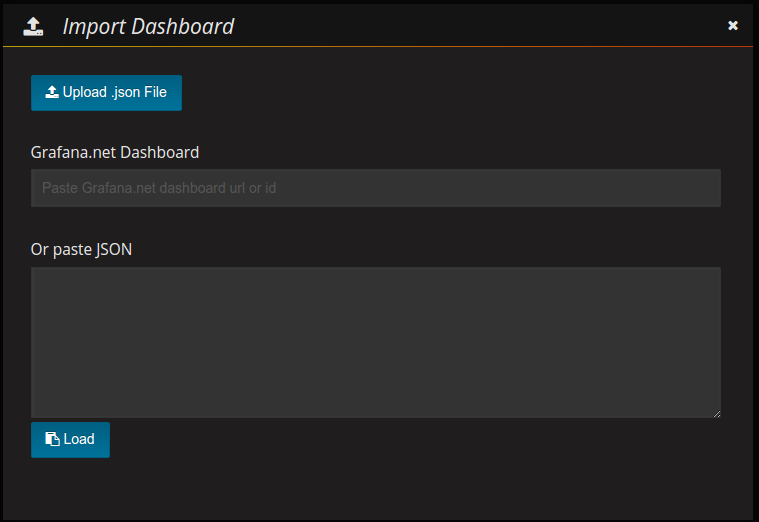
The above screenshot shows the new import modal that gives you 3 options for how to import a dashboard. One notable new addition here is the ability to import directly from Dashboards shared on Grafana.com.
The next step in the import process:
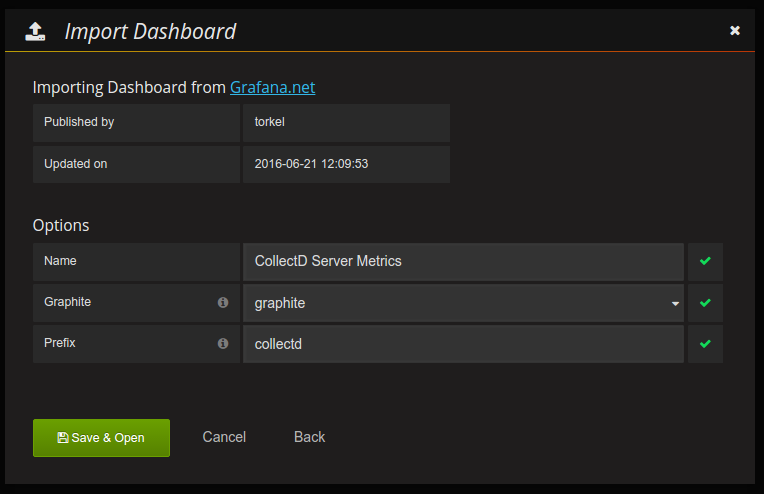
Here you can change the name of the dashboard and also pick what data sources you want the dashboard to use. The above screenshot shows a CollectD dashboard for Graphite that requires a metric prefix be specified.
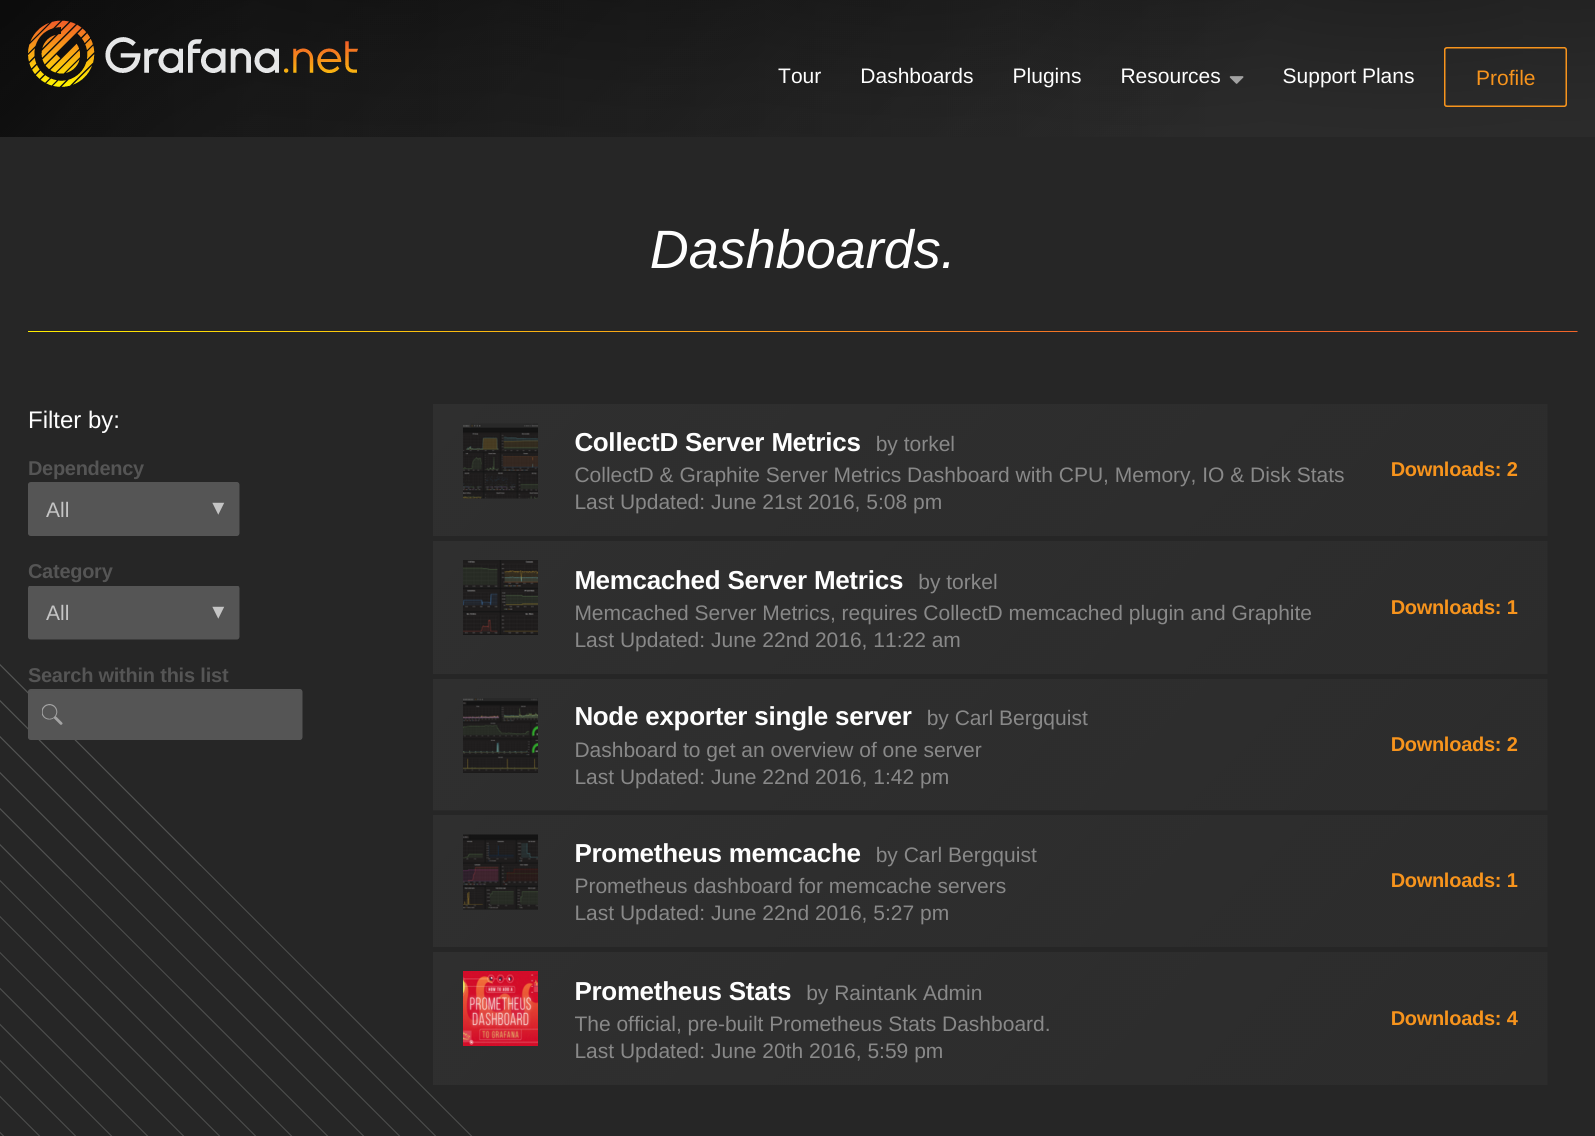
Discover Dashboards
On Grafana.com you can now browse and search for dashboards. We have already added a few but more are being uploaded every day. To import a dashboard just copy the dashboard url and head back to Grafana, then Dashboard Search -> Import -> Paste Grafana.com Dashboard URL.
Constant template variables
We added a new template variable named constant that makes it easier to share and export dashboard that have custom prefixes.
Dashboard Urls
Having current time range and template variable value always sync with the URL makes it possible to always copy your current Grafana url to share with a colleague without having to use the Share modal.
Internal metrics
Do you want metrics about viewing metrics? Of course you do! In this release we added support for sending metrics about Grafana to graphite. You can configure interval and server in the config file.
Logging
Switched logging framework to log15 to enable key value per logging and filtering based on different log levels. It’s now possible to configure different log levels for different modules.
Breaking changes
- Logging format have been changed to improve log filtering.
- Graphite PNG Graphite PNG support dropped from Graph panel (use Grafana native PNG instead).
- Migration No longer possible to migrate dashboards from 1.x (Stored in ES or Influx 0.8).
CHANGELOG
For a detailed list and link to github issues for everything included in the 3.1 release please view the CHANGELOG.md file.


