Important: This documentation is about an older version. It's relevant only to the release noted, many of the features and functions have been updated or replaced. Please view the current version.
What’s New in Grafana v4.6
Grafana v4.6 brings many enhancements to Annotations, Cloudwatch & Prometheus. It also adds support for Postgres as metric & table data source!
Annotations
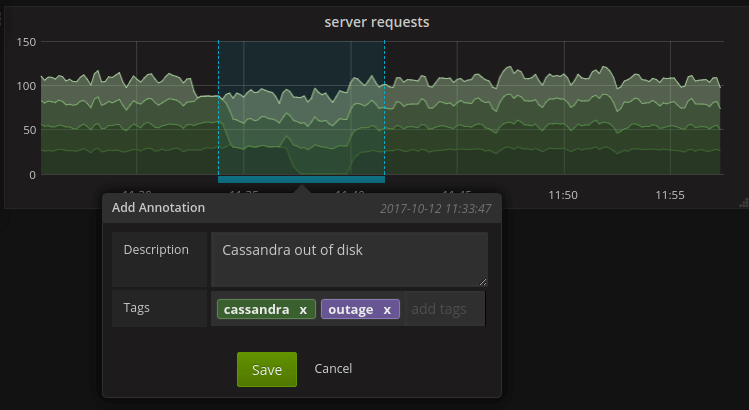
You can now add annotation events and regions right from the graph panel! Just hold CTRL/CMD + click or drag region to open the Add Annotation view. The Annotations documentation is updated to include details on this new exciting feature.
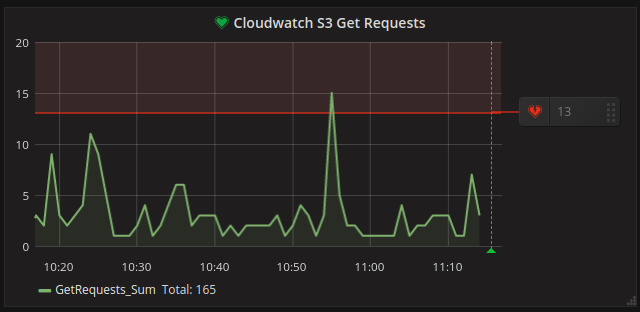
Cloudwatch
Cloudwatch now supports alerting. Setup alert rules for any Cloudwatch metric!
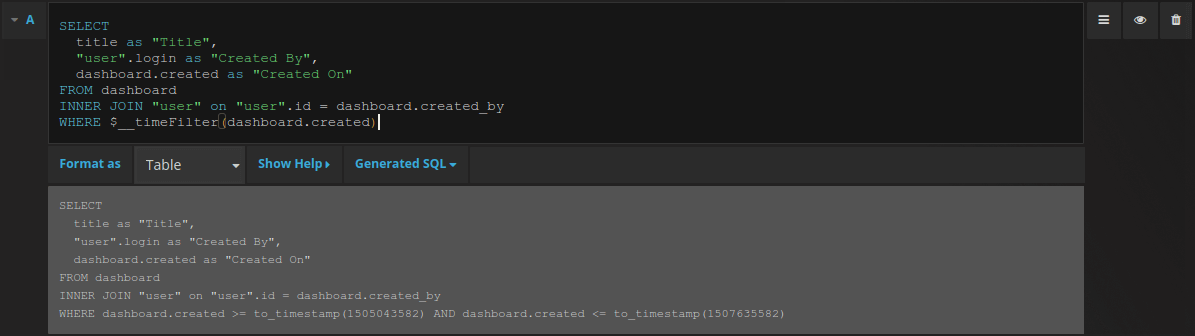
Postgres
Grafana v4.6 now ships with a built-in datasource plugin for Postgres. Have logs or metric data in Postgres? You can now visualize that data and define alert rules on it like any of our other data sources.
Prometheus
New enhancements include support for instant queries and improvements to query editor in the form of autocomplete for label names and label values. This makes exploring and filtering Prometheus data much easier.
Changelog
New Features
- GCS: Adds support for Google Cloud Storage #8370 thx @chuhlomin
- Prometheus: Adds /metrics endpoint for exposing Grafana metrics. #9187
- Graph: Add support for local formatting in axis. #1395, thx @m0nhawk
- Jaeger: Add support for open tracing using jaeger in Grafana. #9213
- Unit types: New date & time unit types added, useful in singlestat to show dates & times. #3678, #6710, #2764
- CLI: Make it possible to install plugins from any url #5873
- Prometheus: Add support for instant queries #5765, thx @mtanda
- Cloudwatch: Add support for alerting using the cloudwatch datasource #8050, thx @mtanda
- Pagerduty: Include triggering series in pagerduty notification #8479, thx @rickymoorhouse
- Timezone: Time ranges like Today & Yesterday now work correctly when timezone setting is set to UTC #8916, thx @ctide
- Prometheus: Align $__interval with the step parameters. #9226, thx @alin-amana
- Prometheus: Autocomplete for label name and label value #9208, thx @mtanda
- Postgres: New Postgres data source #9209, thx @svenklemm
- Datasources: closes #9371, #5334, #8812, thx @mattbostock
Minor Changes
- SMTP: Make it possible to set specific EHLO for smtp client. #9319
- Dataproxy: Allow Grafana to renegotiate tls connection #9250
- HTTP: set net.Dialer.DualStack to true for all http clients #9367
- Alerting: Add diff and percent diff as series reducers #9386, thx @shanhuhai5739
- Slack: Allow images to be uploaded to slack when Token is present #7175, thx @xginn8
- Opsgenie: Use their latest API instead of old version #9399, thx @cglrkn
- Table: Add support for displaying the timestamp with milliseconds #9429, thx @s1061123
- Hipchat: Add metrics, message and image to hipchat notifications #9110, thx @eloo
- Postgres: modify group by time macro so it can be used in select clause #9527, thanks @svenklemm
Tech
- Go: Grafana is now built using golang 1.9


