This is documentation for the next version of Grafana documentation. For the latest stable release, go to the latest version.
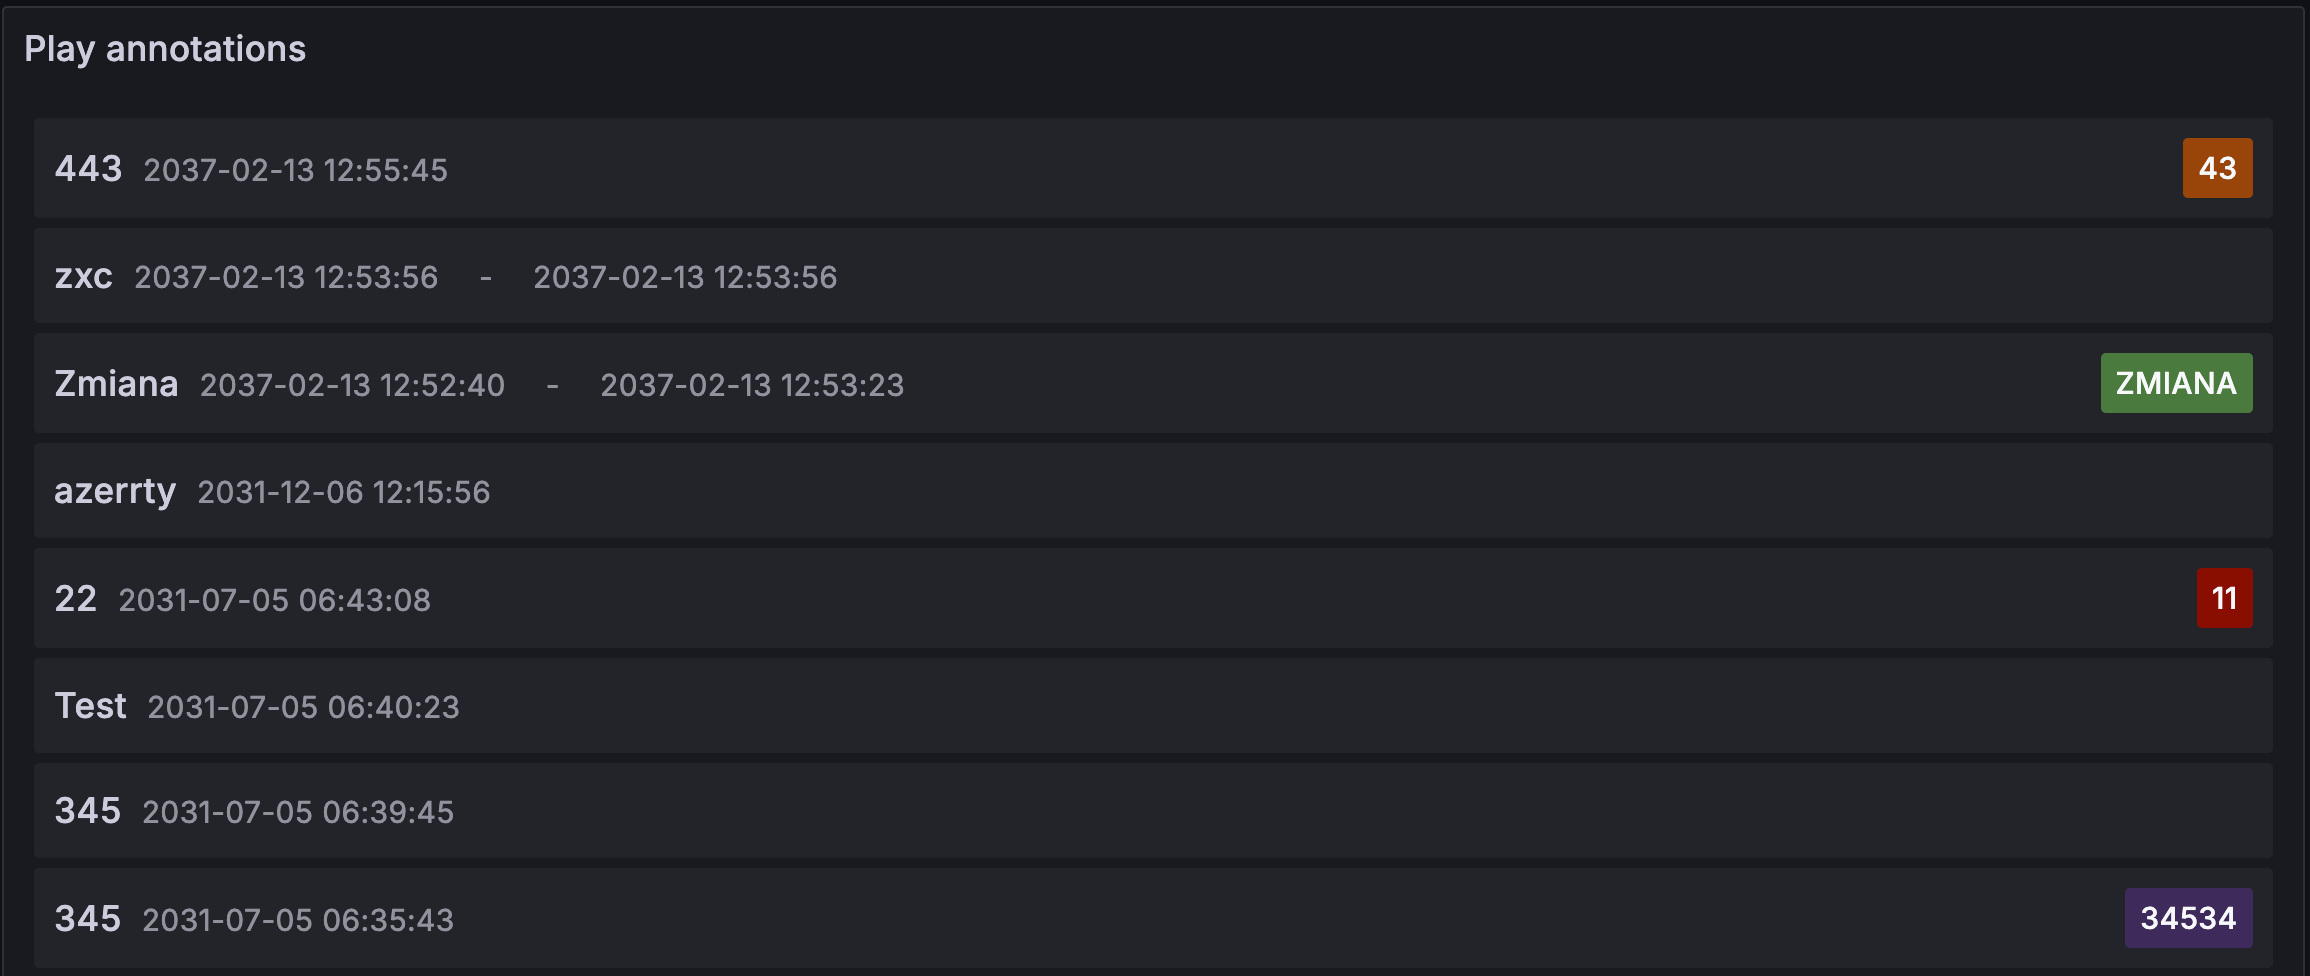
Annotations list
The annotations list shows a list of available annotations you can use to view annotated data. Various options are available to filter the list based on tags and on the current dashboard.
Configuration options
The following section describes the configuration options available in the panel editor pane for this visualization. These options are, as much as possible, ordered as they appear in Grafana.
Panel options
In the Panel options section of the panel editor pane, set basic options like panel title and description, as well as panel links. To learn more, refer to Configure panel options.
Annotation query options
The following options control the source query for the list of annotations:
Query filter
Use the Query filter option to create a list of annotations from all dashboards in your organization or the current dashboard in which this panel is located. Choose from:
- All dashboards - List annotations from all dashboards in the current organization.
- This dashboard - Limit the list to the annotations on the current dashboard.
Time Range
Specify whether the list should be limited to the current time range. Choose from:
- None - No time range limit for the annotations query.
- This dashboard - Limit the list to the time range of the dashboard where the annotations list is available.
Display options
These options control additional metadata included in the annotations list display:
Link behavior options
Use the following options to control the behavior of annotation links in the list:


