This is documentation for the next version of Grafana documentation. For the latest stable release, go to the latest version.
Configure trace to metrics correlation
Trace to metrics lets you navigate from a span in a trace to metrics in a Prometheus or other metrics data source. When configured, a Metrics for this span link appears in the trace view.
Trace to metrics works with any Prometheus-compatible data source and doesn’t require the Tempo metrics generator. The metrics generator creates new metrics from trace data; trace to metrics links to metrics that already exist in your metrics data source.
Before you begin
To configure trace to metrics, you need:
- A Tempo data source configured in Grafana
- A Prometheus-compatible metrics data source configured in Grafana
- Metrics that correspond to your traced services (for example,
requests_total,request_duration_seconds) - Editor or Admin permissions in Grafana
Note
You can’t modify a provisioned data source from the Grafana UI. If you’re using Grafana Cloud Traces (the pre-configured tracing data source in Grafana Cloud), its settings are read-only. To configure trace to metrics, clone the data source to create an editable copy, or update the provisioning file for self-managed instances. Refer to the Provisioning section for details.
There are two ways to configure the trace to metrics feature:
- Use a basic configuration with a default query.
- Configure one or more custom queries where you can use a template language to interpolate variables from the trace or span.
Set up a basic configuration
To use a basic configuration, follow these steps:
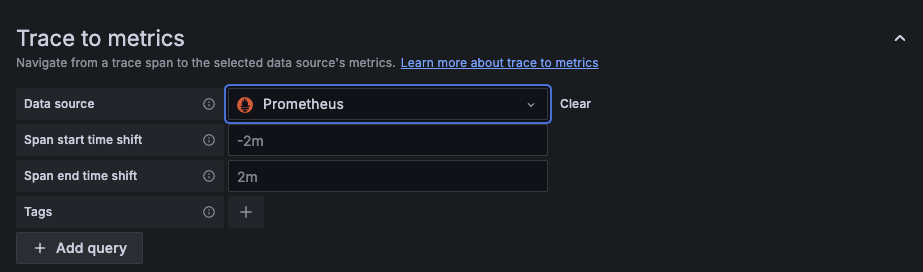
Select a metrics data source from the Data source drop-down.
Optional: Change Span start time shift and Span end time shift. The placeholders show
-2m(start) and2m(end), which are applied if you leave the fields empty.Optional: Choose any tags to use in the query. Click Add tag to add a tag mapping.
The tags you configure must be present in the spans attributes or resources for a trace to metrics span link to appear. You can optionally configure a new name for the tag. This is useful if the tag has dots in the name and the target data source doesn’t allow using dots in labels. For example, you can remap
service.nametoservice_name.Don’t select Add query.
Select Save and Test.
Set up custom queries
To use custom queries, you need to configure the tags you’d like to include in the linked queries.
For each tag, the key is the span attribute name.
In cases where the attribute name would result in an invalid metrics query or doesn’t exactly match the desired label name, you can enter the label name as the second value.
For example, you could map the attribute k8s.pod to the label pod.
You can interpolate the configured tags using the $__tags keyword.
For example, when you configure the query requests_total{$__tags} with the tags k8s.pod=pod and cluster, it results in requests_total{pod="nginx-554b9", cluster="us-east-1"}.
The label values are dynamically inserted based on the span attributes’ values.
You can link to any metric you’d like, but metrics for span durations, counts, and errors filtered by service or span are a great starting point.
To use custom queries with the configuration, follow these steps:
Select a metrics data source from the Data source drop-down.
Optional: Choose any tags to use in the query. Click Add tag to add a tag mapping.
These tags can be used in the custom query with the
${__tags}variable. This variable interpolates the mapped tags as a list in an appropriate syntax for the data source and only includes the tags that were present in the span, omitting those that weren’t present. You can optionally configure a new name for the tag. This is useful in cases where the tag has dots in the name and the target data source doesn’t allow using dots in labels. For example, you can remapservice.nametoservice_name. If you don’t map any tags here, you can still use any tag in the query like this:method="${__span.tags.method}". Refer to Custom query variables for the full list of available variables.Click Add query to add a custom query.
Specify a custom query to be used to query metrics data.
Each linked query consists of:
- Link Label: (Optional) Descriptive label for the linked query.
- Query: The query ran when navigating from a trace to the metrics data source.
Interpolate tags using the
$__tagskeyword. For example, when you configure the queryrequests_total{$__tags}with the tagsk8s.pod=podandcluster, the result looks likerequests_total{pod="nginx-554b9", cluster="us-east-1"}.
Select Save and Test.
Configuration options
The following table describes options for configuring the Trace to metrics settings:
Provisioning
You can provision the trace to metrics configuration using the tracesToMetrics block in your data source YAML file.
For the full provisioning YAML example including all Tempo settings, refer to
Provision the Tempo data source.
Link from metrics to traces
To navigate in the reverse direction, from a metric to its associated trace, configure exemplars in your Prometheus data source. Refer to Exemplars for setup instructions.
Troubleshooting
If trace to metrics links aren’t appearing or return no data, refer to Trace to logs/metrics/profiles issues in the troubleshooting guide.
If the configuration fields are greyed out, your data source is provisioned. Refer to the Provisioning section for how to update the configuration via YAML.
Next steps
- Configure trace to logs correlation: Navigate from spans to related logs in Loki.
- Configure trace to profiles correlation: Link spans to profiling data in Grafana Pyroscope.
- Provision the Tempo data source: Configure the Tempo data source using a YAML file.


