This is documentation for the next version of Grafana documentation. For the latest stable release, go to the latest version.
Configure trace to logs correlation
Trace to logs correlation lets you navigate from a span in Tempo directly to the matching logs in Loki, and from a log line in Loki back to its trace in Tempo. When configured, a Logs for this span link appears in the trace view and a link to the configured tracing data source appears on log lines that contain a trace ID.
This is a two data source configuration:
- Tempo data source: Controls how Grafana queries logs when you click a span, including the time window, query, and tags to match.
- Loki data source: Controls how trace IDs are extracted from log lines and linked back to traces.
Both sides must be configured for the correlation to work in either direction.
Before you begin
To configure trace to logs correlation, you need:
- A Tempo data source configured in Grafana
- A Loki data source configured in Grafana
- Applications that emit traces and logs with a shared identifier such as a trace ID, service name, or both
- Editor or Admin permissions in Grafana
Note
You can’t modify a provisioned data source from the Grafana UI. If you’re using Grafana Cloud Traces (the pre-configured tracing data source in Grafana Cloud), its settings are read-only. To configure trace to logs, clone the data source to create an editable copy, or update the provisioning file for self-managed instances. Refer to Provision trace to logs settings for details.
Configure the Tempo data source
These settings control how Grafana queries your log data source when you click a span in the trace view. This guide uses Loki, but Trace to logs also supports Elasticsearch, Splunk, OpenSearch, Falcon LogScale, Google Cloud Logging, and VictoriaMetrics Logs.
Go to Connections > Data sources and select your Tempo data source.
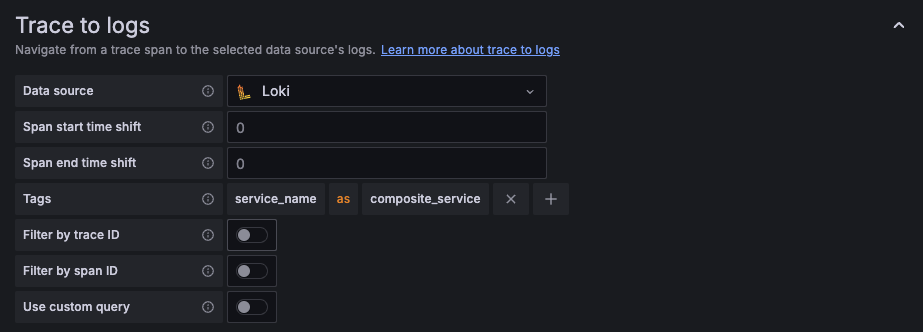
Scroll to the Trace to logs section.
Select your Loki data source from the Data source drop-down list.
Configure the Span start time shift and Span end time shift fields.
These fields expand the log query time window around the span’s start and end timestamps. A span’s timestamps are precise to the millisecond, but log lines are often written slightly before or after the span boundary. The default value of
0can return no logs if timestamps don’t align exactly. A common starting point is-2sfor start shift and2sfor end shift.You can increase this value for spans that represent slow or batch operations, for example
5s.Configure Tags to map span attributes to Loki label names.
Grafana uses these tags to filter logs to the correct service, Pod, or cluster. The Loki label name you enter must exactly match the label name on your Loki streams. A mismatch silently breaks the correlation with no error shown.
If you don’t configure any tags, Grafana uses the following defaults:
cluster,hostname,namespace,pod,service.name(remapped toservice_name), andservice.namespace(remapped toservice_namespace). The automatic dot-to-underscore remapping only applies to these default tags. For custom tags, you must specify the remapped name explicitly.To customize the mapping, use the Add tag button to add each row. The following table shows common tags and their typical Loki label equivalents:
Choose labels with low cardinality. In Loki, every unique combination of label values creates a separate stream. Labels that take on many distinct values, such as
pod,host,thread,duration,traceId, orspanId, can create hundreds of thousands or even millions of streams, causing slow queries, high memory usage, and log loss at ingest. The labels listed above (service_name,namespace,cluster) are good choices because they have a bounded, small set of values. If you need to query high-cardinality values like trace IDs or Pod names, store them as structured metadata instead. They are queryable without creating additional streams. For more information, refer to Cardinality.Note
When using Loki, the Logs for this span link only appears on a span if at least one of the configured tags exists on that span. If none of the tags match, the link doesn’t appear and no error is shown.
Configure the Filter by trace ID and Filter by span ID toggles.
- Filter by trace ID: Filters Loki results to all logs for the entire trace, not just the selected span. This works well for most use cases.
- Filter by span ID: Filters to logs for a single span. This only works if your logs include a span ID field.
These toggles are disabled when Use custom query is enabled because the custom query controls filtering directly.
Clicking Logs for this span filters by trace ID, not span ID, so results include all logs for the entire trace that contain a matching trace ID, not only logs emitted during that specific span. If your results look broader than expected, this is expected behavior. To narrow results to a specific span’s activity, write a custom LogQL query that filters on span ID or span-specific attributes if your application logs them, for example
{service_name="my-service"} | json | spanId="". For this feature to work at all, your application must inject trace IDs into log lines, for example, using OpenTelemetry SDK structured logging. Without trace IDs in logs, the query falls back to a time-range filter.Optional: Enable Use custom query and write a LogQL expression to replace the auto-generated query.
Use
${__tags}to inject the mapped tag filters automatically:{${__tags}} | logfmt | trace_id=`${__trace.traceId}`Refer to Custom query variables for the full list of available variables.
Click Save & test.
Configure the Loki data source
These settings enable the Tempo link on Loki log lines, letting you navigate from a log entry to its trace.
Note
Configuring the Tempo data source without also configuring the Loki data source is a common mistake. If you skip this step, clicking a log line doesn’t open a trace. Both sides are required.
Go to Connections > Data sources and select your Loki data source.
In the Additional settings section, scroll to Derived fields.
Click Add to add a new derived field.
Enter a Name for the field, for example
TraceID.Select the Type and enter a pattern to extract the trace ID from log lines.
If you select Regex in log line, enter a regular expression with one capture group. The following table shows common patterns:
If you select Label, enter a regular expression that matches the label key, for example
trace[_]?idto match bothtraceidandtrace_id.Tip
If your applications use different trace ID field names, you need a separate derived field entry for each format. To simplify this, standardize on OpenTelemetry structured metadata so trace IDs are stored as a consistent label.
Enable the Internal link toggle and select your Tempo data source from the drop-down list.
In the Query field, enter
${__value.raw}.This passes the extracted trace ID to Tempo when the link is clicked. The field shows
${__value.raw}as placeholder text, but you must enter it as the actual value.Click Save & test.
For more details about derived field options, refer to Derived fields in the Loki data source documentation.
Provision trace to logs settings
You can provision the trace to logs configuration using the tracesToLogsV2 block in your data source YAML file.
For the full provisioning YAML example including all Tempo settings, refer to
Provision the Tempo data source.
For general provisioning instructions, refer to
Provisioning data sources.
Example: NGINX service
This example assumes:
- Applications running in Kubernetes that emit OpenTelemetry traces to Tempo
- Logs sent to Loki with labels
service_name,namespace, andpod - Trace IDs written to logs as
trace_id=<VALUE>
The Tempo data source settings are:
The Loki data source derived field settings are:
Expected result
After configuring both data sources:
- In Explore with the Tempo data source selected, click any span and then click Logs for this span. Loki opens filtered to
service_name=nginxandnamespace=productionwithin the configured time window around the span. - In Explore with the Loki data source selected, any log line containing
trace_id=...shows a link to your Tempo data source. Clicking it opens the full trace in Tempo.
Troubleshooting
If trace to logs links aren’t appearing, return no data, or only work for some services, refer to Trace to logs/metrics/profiles issues in the troubleshooting guide.
If the configuration fields are greyed out, your data source is provisioned. Refer to Provision trace to logs settings for options.
Next steps
- Configure trace to metrics correlation: Link spans to metrics queries in Prometheus.
- Configure trace to profiles correlation: Link spans to profiling data in Grafana Pyroscope.
- Configure the Tempo data source: Return to connection, authentication, and streaming settings.


