Documentation for automated readers A curated documentation index is available at: https://grafana.com/llms.txt
A complete documentation index is available at: https://grafana.com/llms-full.txt These indexes can help with page discovery before fetching individual documents.
This page is also available in Markdown, which may be easier for automated readers
and AI tools to parse than HTML. The Markdown version is available at
https://grafana.com/docs/grafana/latest/whatsnew/whats-new-in-v13-0.md, or by sending
Accept: text/markdown to https://grafana.com/docs/grafana/latest/whatsnew/whats-new-in-v13-0/. For broader
documentation discovery, the curated index is available at https://grafana.com/llms.txt
and the complete index is available at https://grafana.com/llms-full.txt.
Welcome to Grafana 13.0! In this Grafana release we help solve the blinking cursor problem, helping teams to onboard and get insights from their data faster than ever. Easily take advantage of dashboards bundled with data sources or provided by the community, use templates to build faster and more consistently, save and share queries between your teams, and take the guess work out of panel choices with recommended suggestions.
Dynamic dashboards, our next generation of dashboarding, reaches general availability. The increased flexibility and adaptability makes building dashboards delightful, and helps teams consolidate and share a single source of truth. Additionally reaching general availability, Git Sync allows powerful bidirectional GitOps-helping you to manage your Grafana resources reliably at scale.
And that’s not all. There is a lot more to discover in Grafana 13, from the new Gauge visualization, new data sources, improved annotations, the list goes on. Read on to find out more and try for yourself!
For even more detail about all the changes in this release, refer to the changelog. For the specific steps we recommend when you upgrade to v13.0, check out our
Upgrade Guide.
Breaking changes in Grafana v13.0
For Grafana v13.0, we’ve also provided a list of
breaking changes to help you upgrade with greater confidence.
Grafana CloudGenerally AvailableOpen sourceGenerally Available
Dashboards and visualizations
Git Sync is now generally available for all Grafana Cloud and self-managed Grafana users.
Connect your Grafana instance to GitHub, GitLab, Bitbucket, or any git repository to manage dashboards as code. You can edit dashboards directly in Grafana and then save, commit, and open a pull request without leaving the UI.
Grafana CloudGenerally AvailableOpen sourceEnterpriseGenerally Available
Dashboards and visualizations
Dynamic dashboards are now on by default for all Grafana Cloud users and self-managed Grafana instances. Every new and existing dashboard uses the new layout engine, editing experience, and dashboard structure automatically. Your existing dashboards are migrated to the new schema when you open them. No manual steps required.
Grafana CloudAvailable in public previewOpen sourceEnterpriseAvailable in public preview
Dashboards and visualizations
We’ve integrated Grafana Assistant into dashboard templates, so you can now ask the Assistant to help you with the process.
Templates are a powerful way to create dashboards quickly, but they don’t always match your real-world metric names or data sources.
The Assistant bridges that gap by:
Grafana CloudAvailable in public previewEnterpriseAvailable in public preview
Dashboards and visualizations
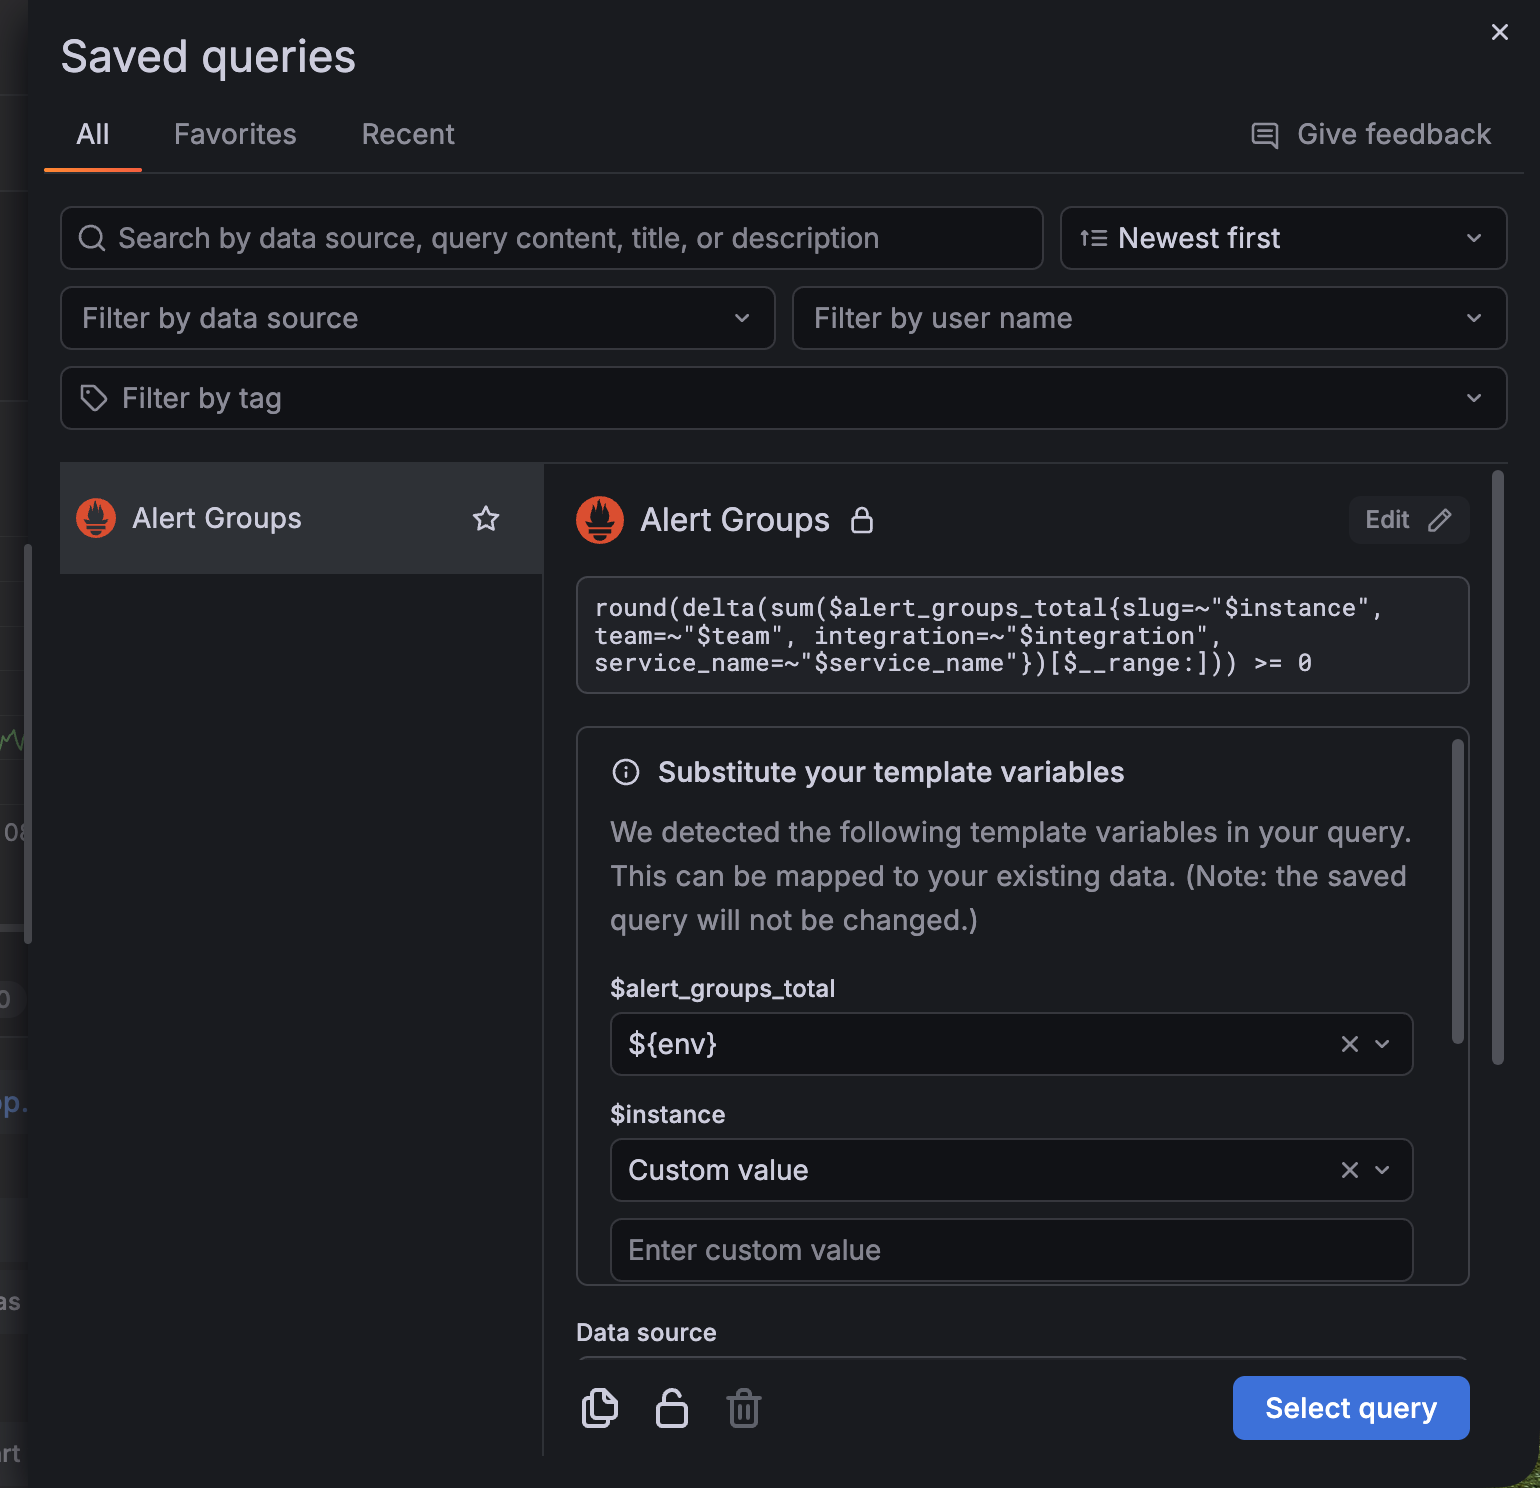
You can now substitute variables when selecting a saved query without modifying the original query.
Previously, if a saved query contained variables that weren’t in your dashboard, Grafana displayed a compatibility warning and limited how the query could be reused.
With this update, the warning is replaced with a section where you can update the variable (for example, ${job}) inline by mapping the variable to either:
Grafana CloudAvailable in public previewOpen sourceEnterpriseAvailable in public preview
Dashboards and visualizations
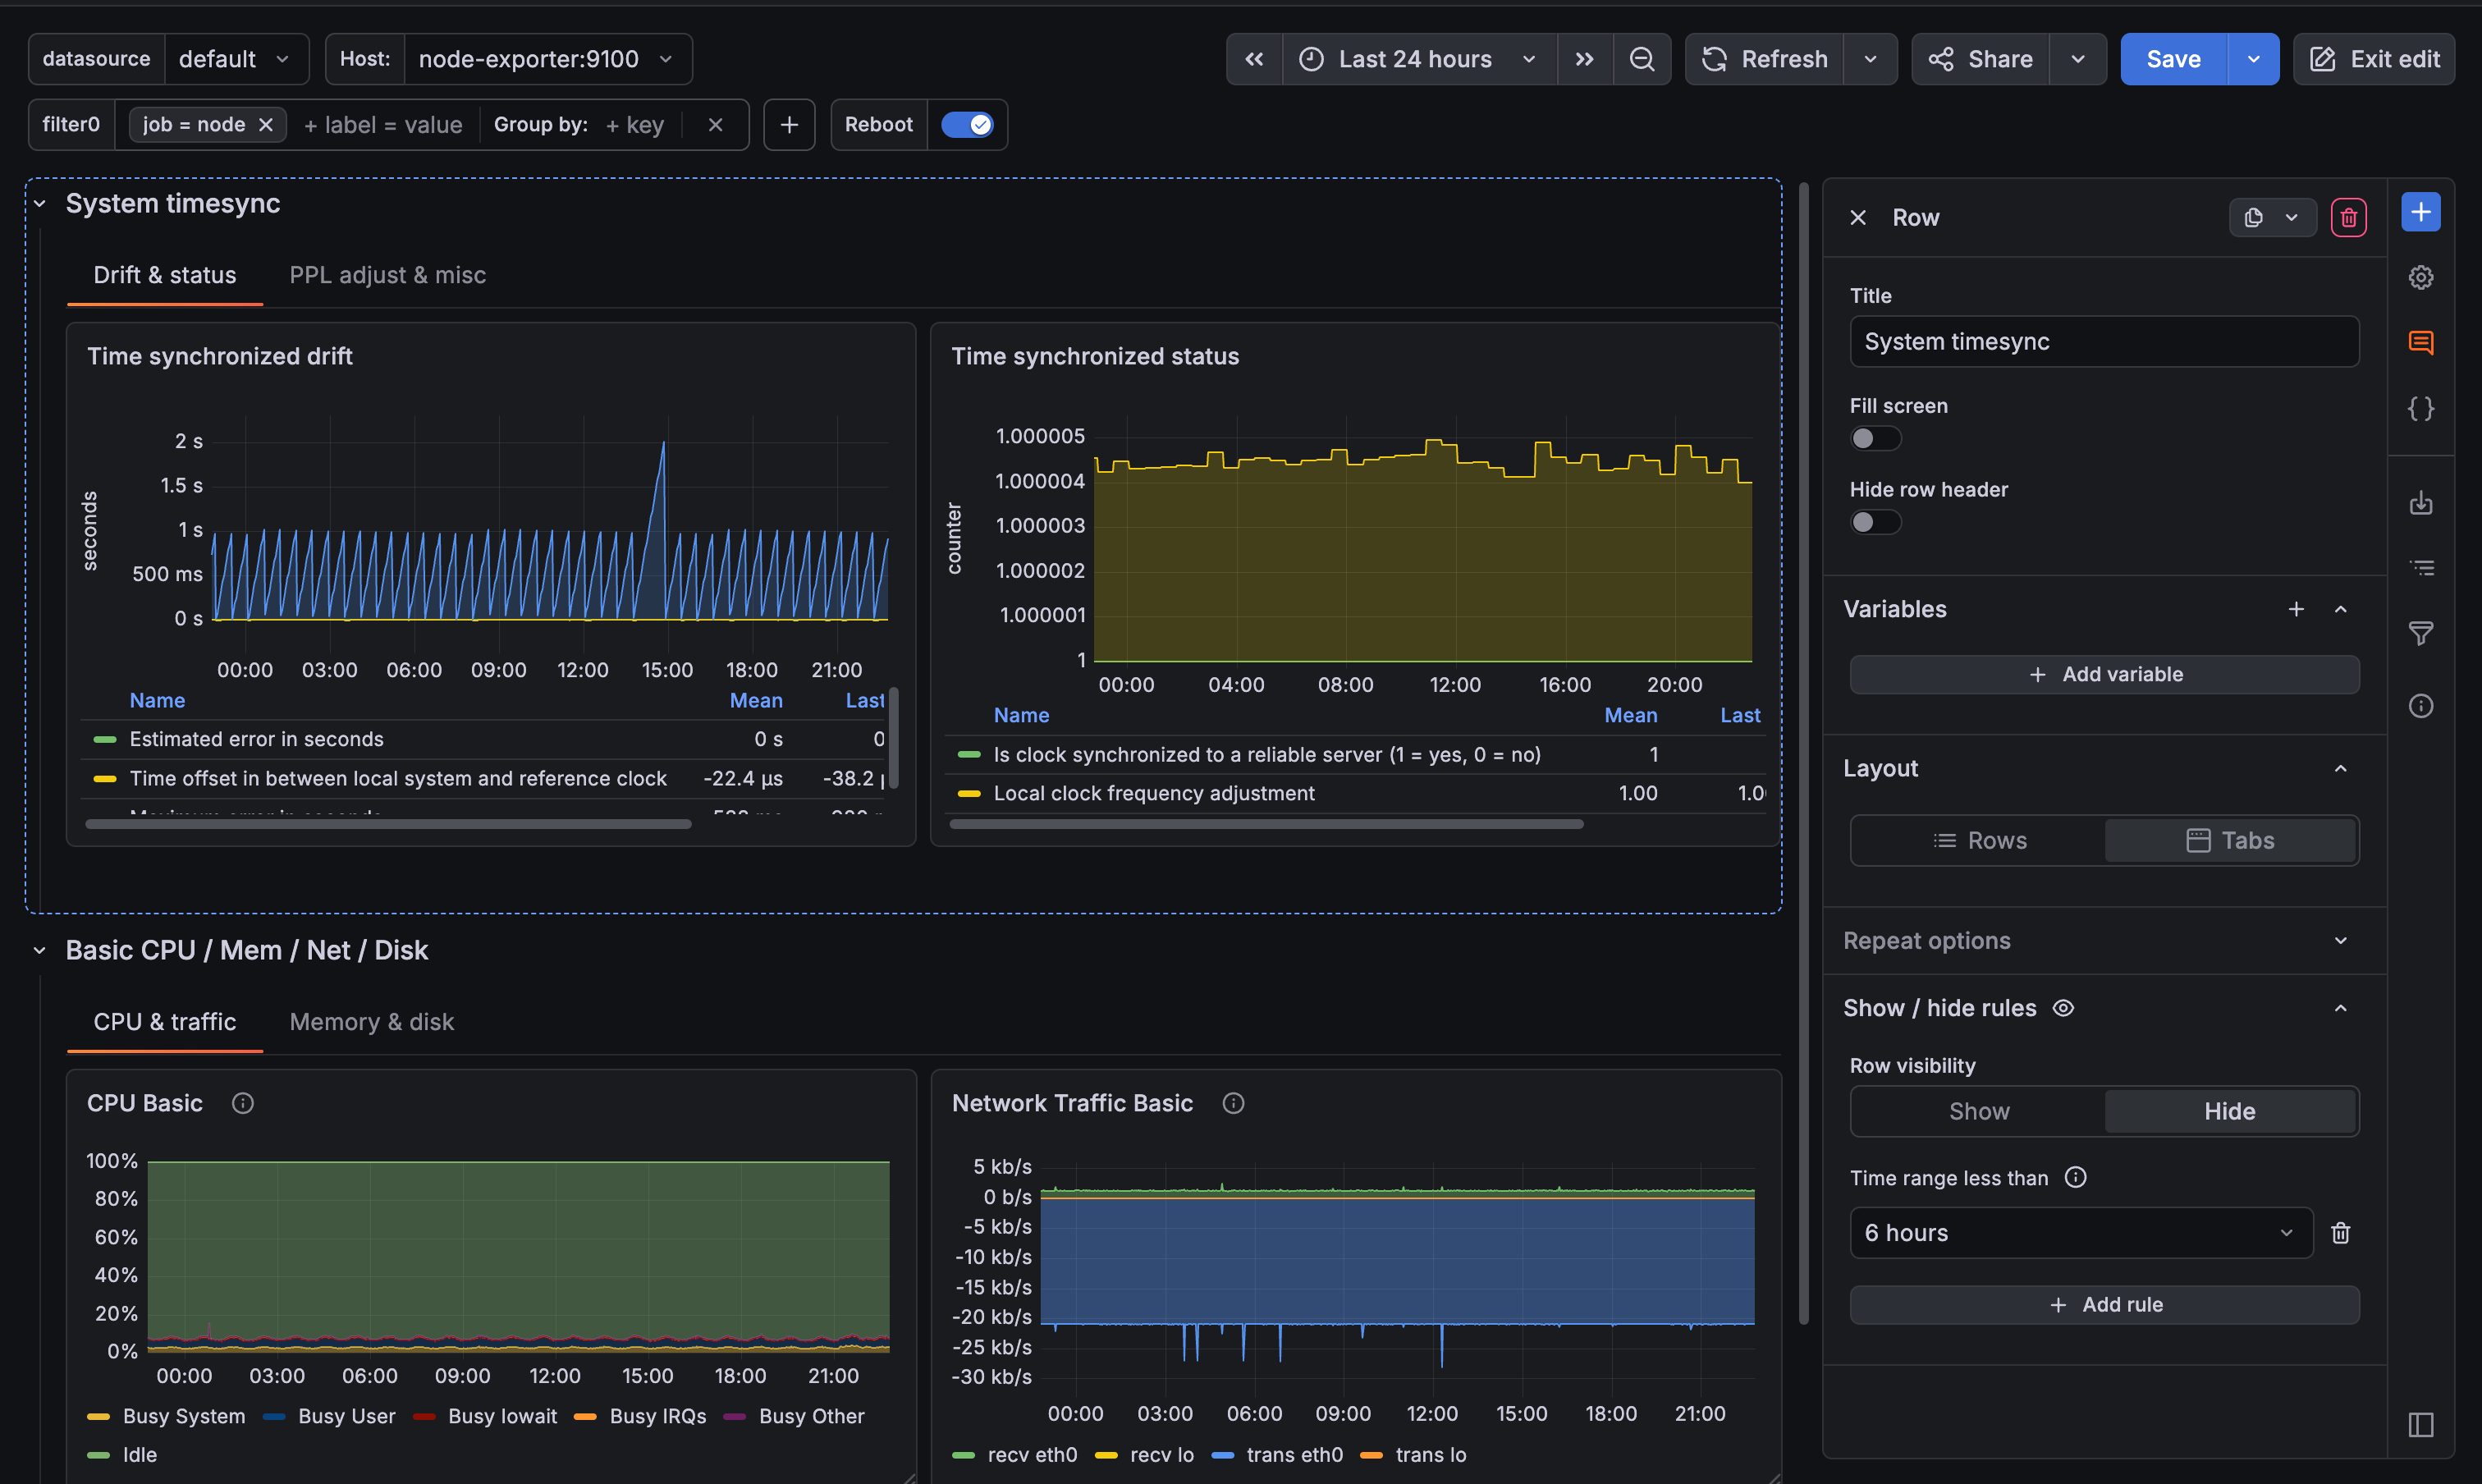
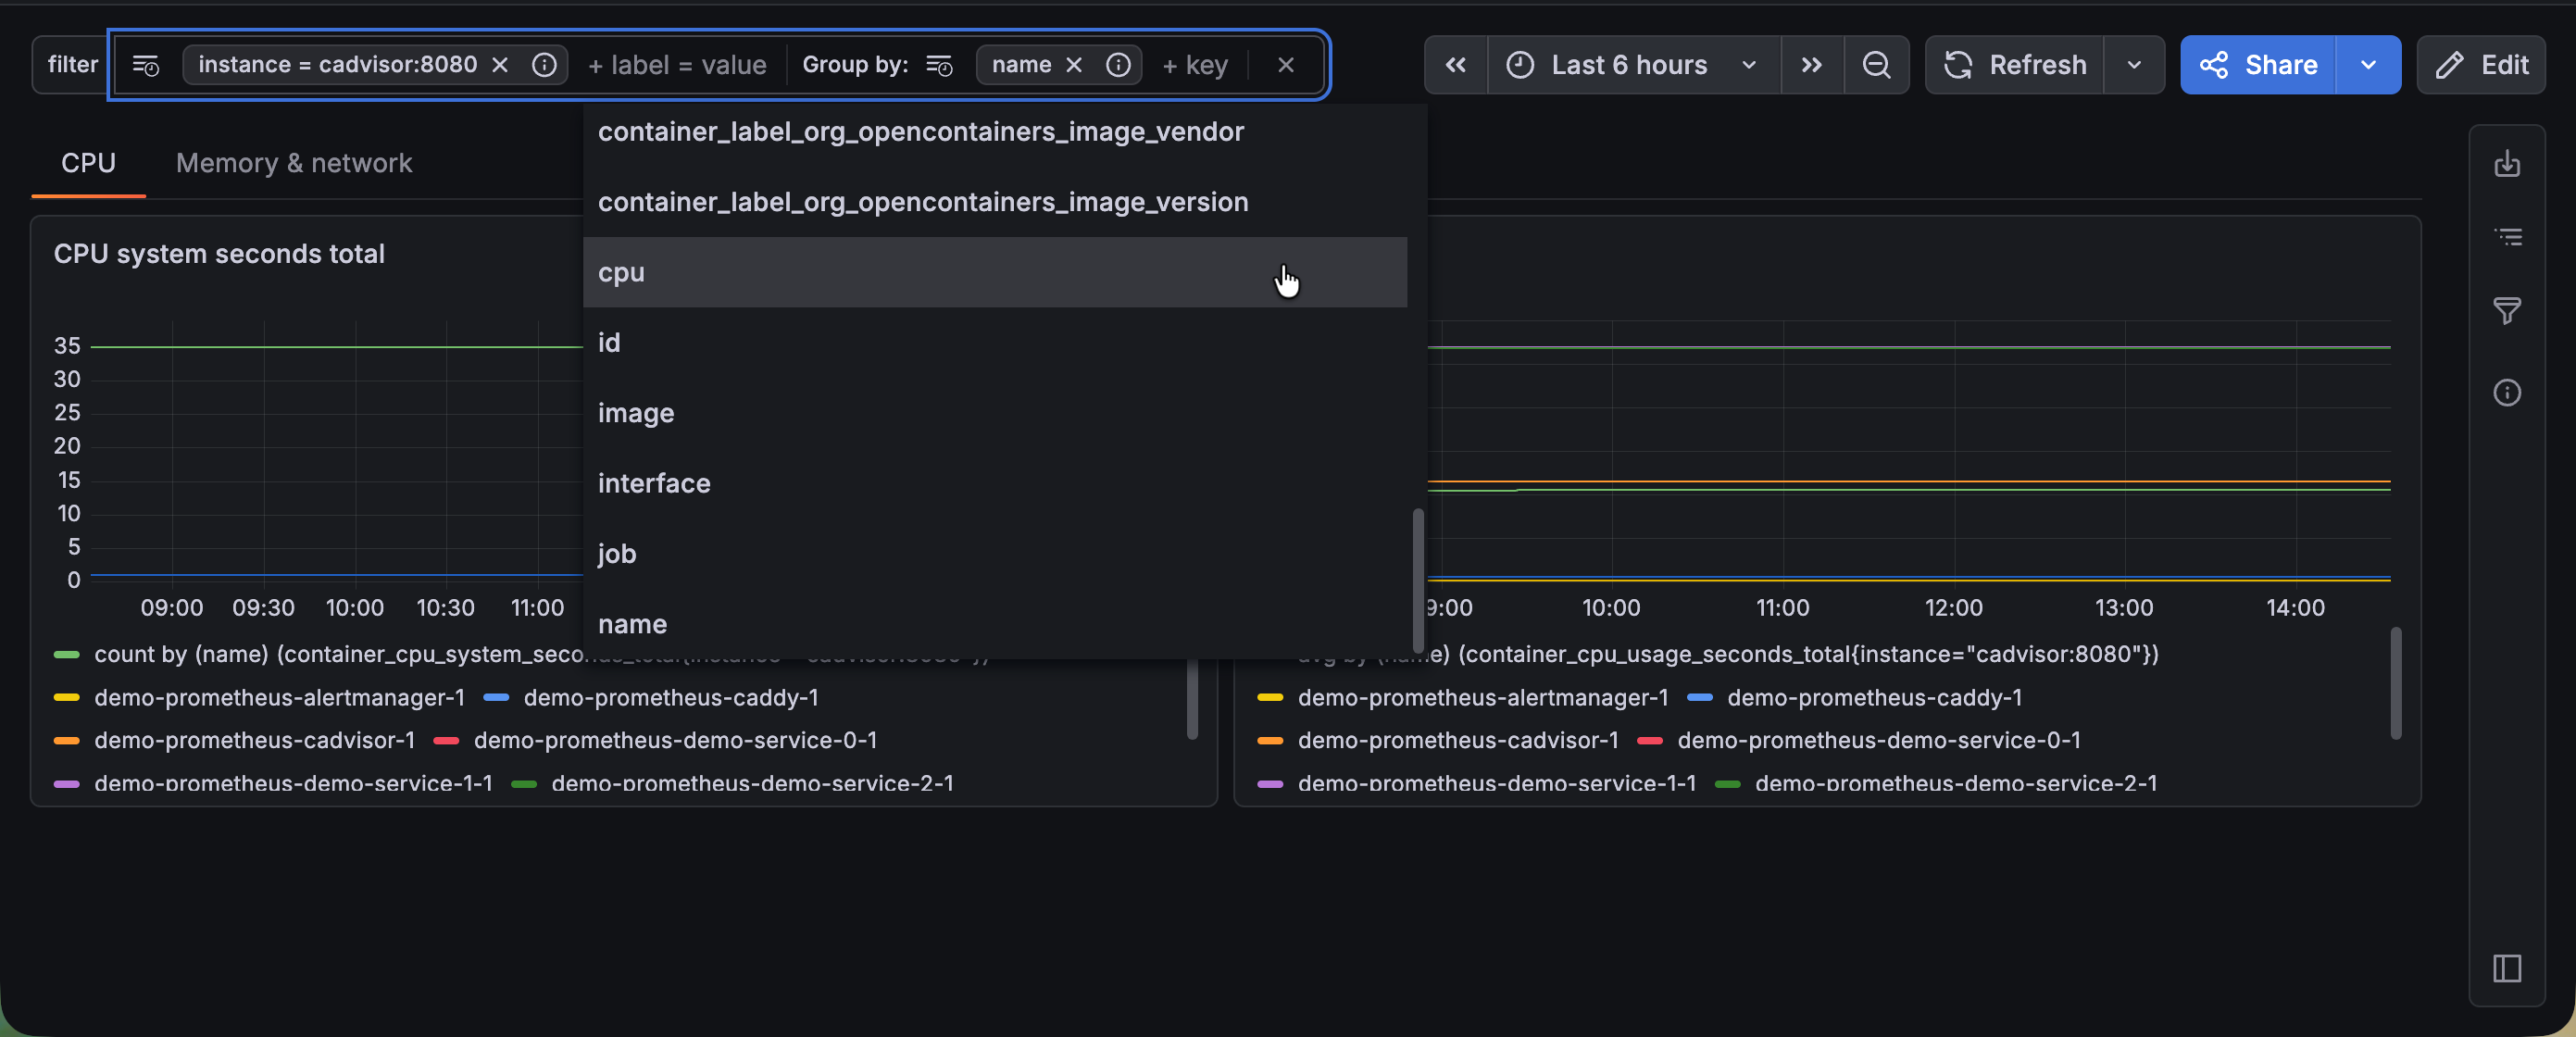
Drilling down into your data across a dashboard has traditionally meant working with basic filter controls, re-entering the same filters you used yesterday, and losing track of which filters are active when many are applied. Introducing the new Filter and Group by dashboard control to tackle all of these friction points and make dashboard exploration faster and more intuitive.
Grafana CloudGenerally AvailableOpen sourceEnterpriseGenerally Available
Dashboards and visualizations
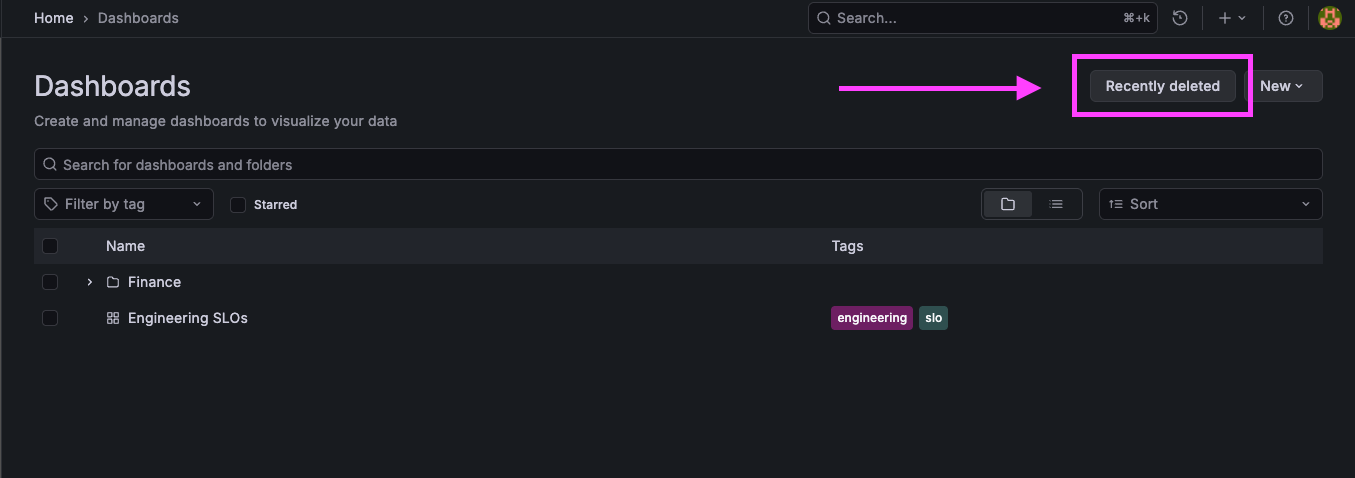
The restore dashboards feature is now generally available! We would love your feedback, you can share it here.
You can restore dashboards you’ve deleted without the need for a support ticket. With the new Recently deleted view, accidentally removing a dashboard no longer means lost work or rebuilding panels from scratch.
Grafana CloudGenerally AvailableOpen sourceEnterpriseGenerally Available
Dashboards and visualizations
In January 2026, we released the revamped gauge visualization in public preview. This new experience is now generally available. For a full description of the changes, refer to the public preview announcement.
Grafana CloudGenerally AvailableOpen sourceEnterpriseGenerally Available
Dashboards and visualizations
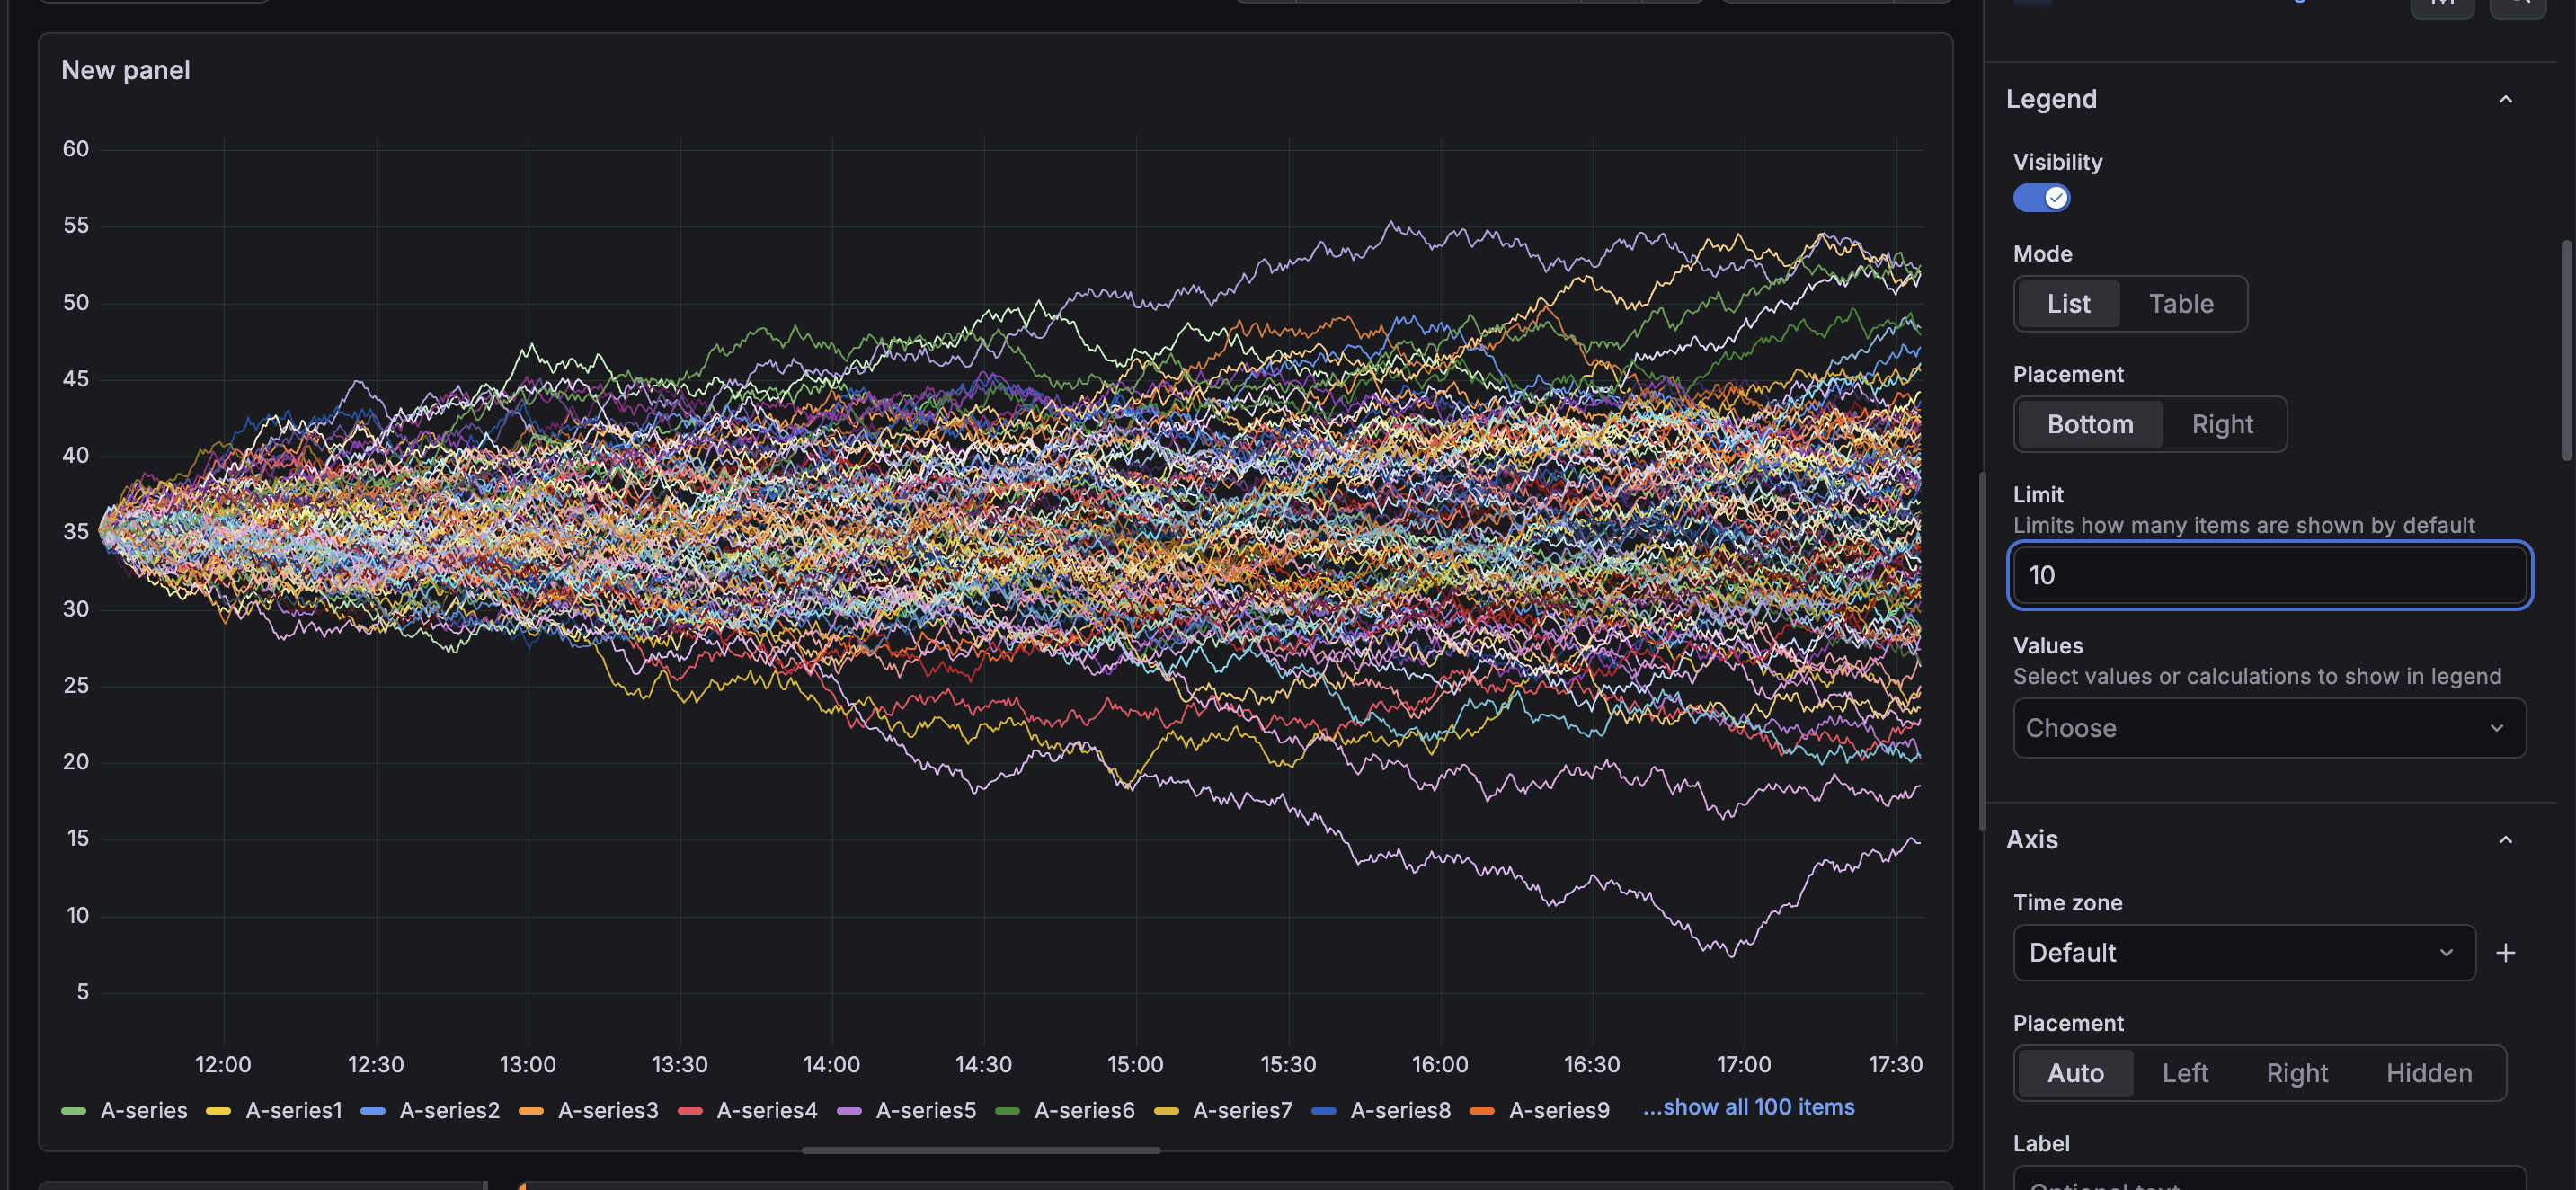
Panels displaying hundreds or thousands of series can potentially run into performance bottlenecks when rendering their legends. Each legend item adds DOM nodes to the page, and that can add up when your visualization displays thousands of series. It can also be visually distracting if your user is not actively engaging with the legend.
Grafana CloudAvailable in public previewOpen sourceEnterpriseAvailable in public preview
Dashboards and visualizations
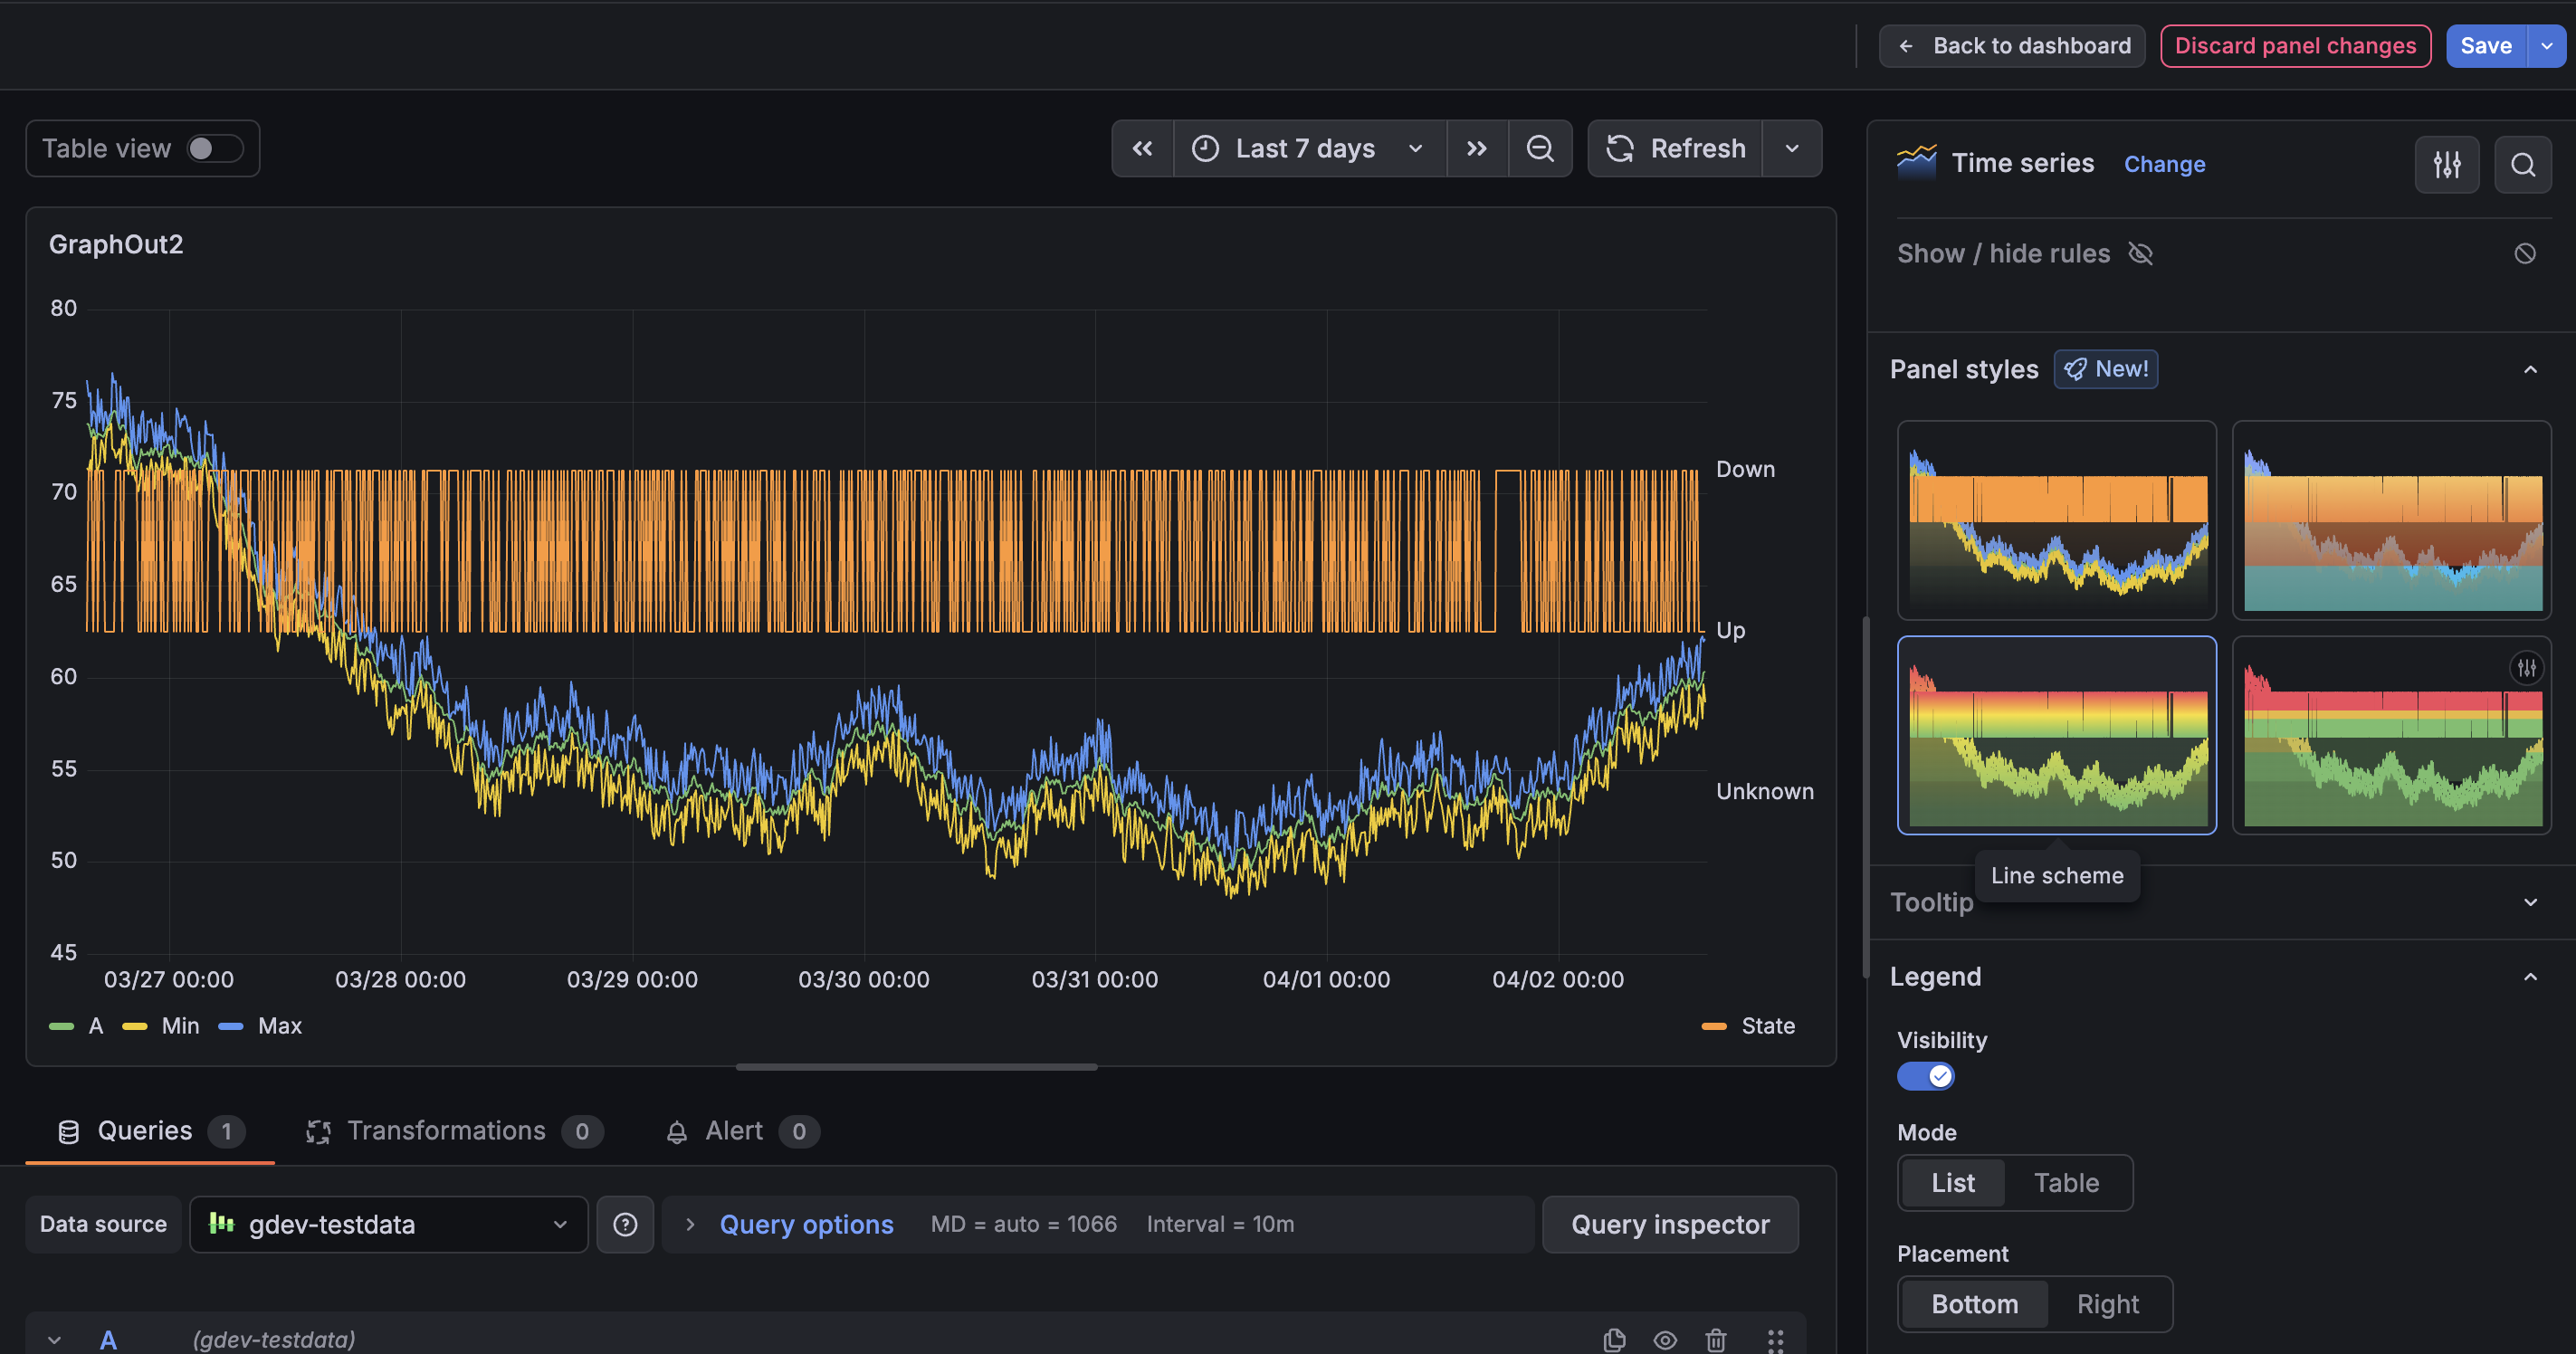
You can now apply Panel styles to quickly update your panels without adjusting multiple options manually. Panel styles provide a curated set of configurations—such as colors, thresholds and display options—so you can quickly get to a more polished visualization with a single click. Panel styles are currently supported in time series, gauge, bar gauge, stat, and bar chart visualizations.
Grafana CloudAvailable in public previewOpen sourceEnterpriseAvailable in public preview
Dashboards and visualizations
We’ve introduced several improvements to annotations to make them easier to explore, navigate, and manage at scale.
Annotation clustering
Group adjacent point annotations into a single combined region with the Annotation clustering switch.
Clustered annotations aggregate their contents into a single, scrollable tooltip, so you can explore dense annotation data without overwhelming the panel.
Grafana CloudExperimentalOpen sourceEnterpriseExperimental
Dashboards and visualizations
Styling panels in Grafana used to require a lot of manual work: editing each panel individually, or duplicating one just to reuse its look and then swapping out the query. With the new copy-paste styles feature, you can copy the styling from one panel and apply it to another in just a couple of clicks.
Grafana CloudAvailable in public previewOpen sourceEnterpriseAvailable in public preview
Dashboards and visualizations
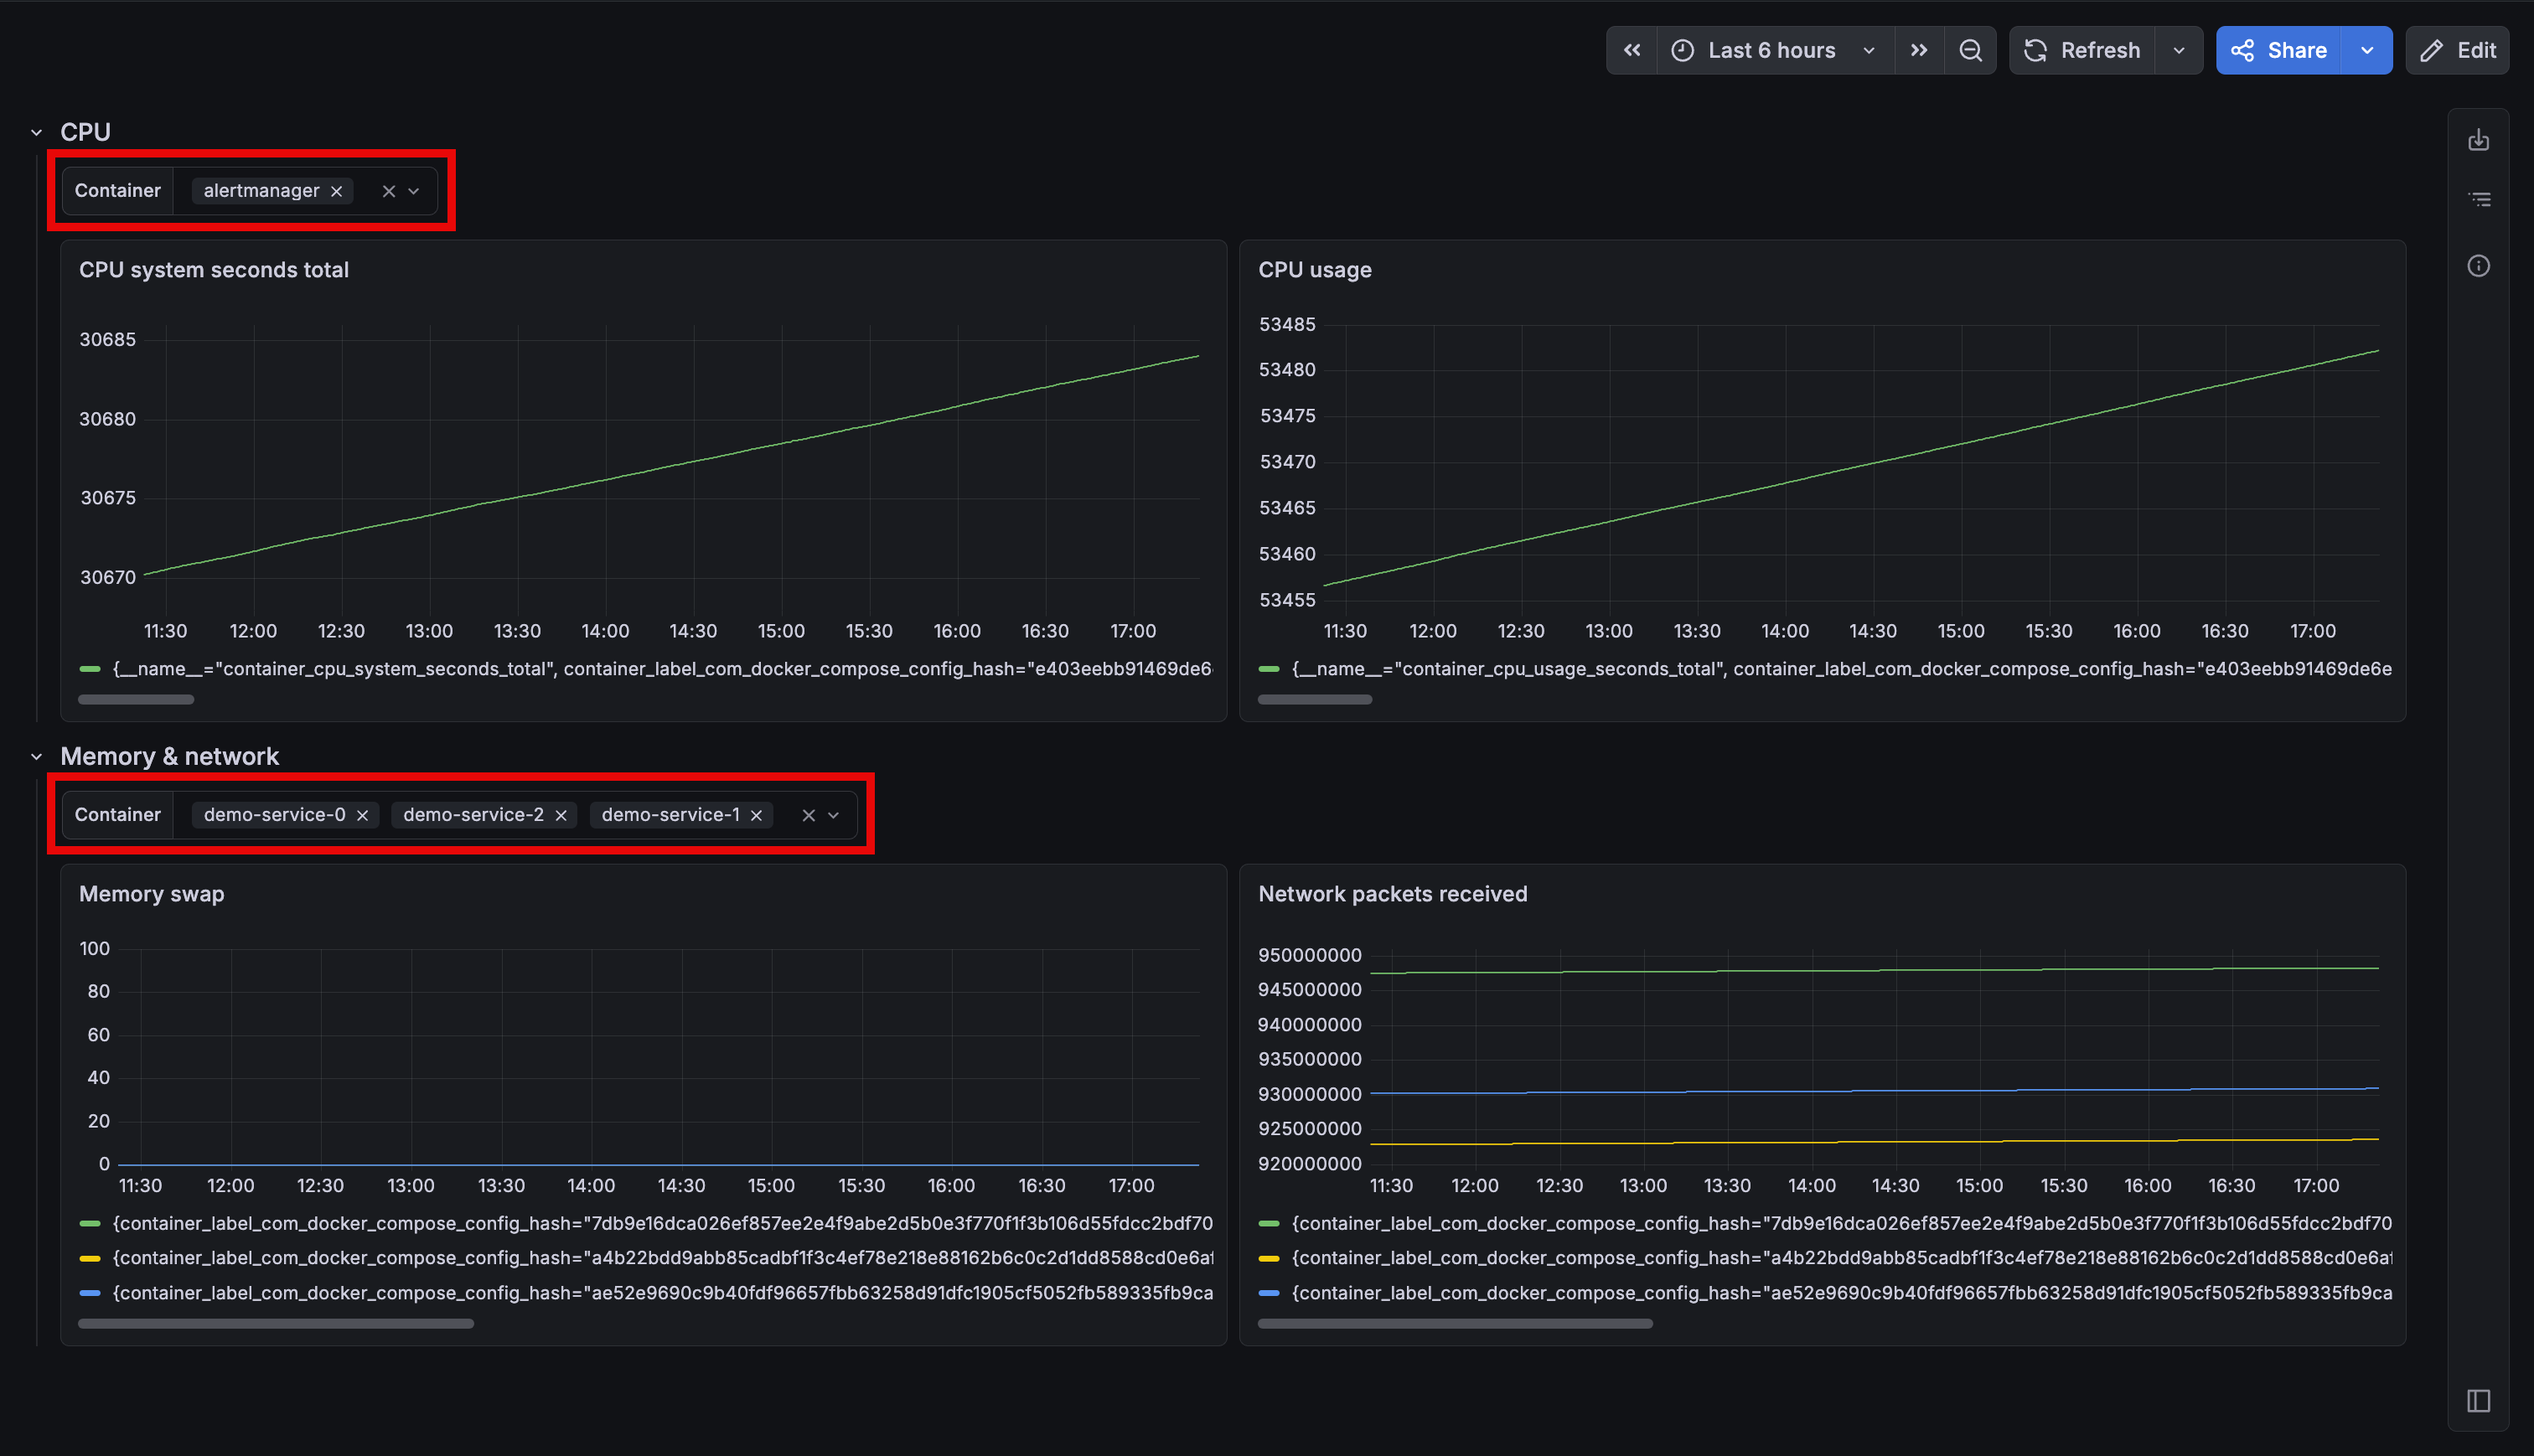
If your dashboard includes both an API gateway and a database, changing something like an $instance variable affects all panels at once. To avoid this, you might have to split up services across separate dashboards, which defeats the goal of having a unified view.
Grafana CloudAvailable in public previewOpen sourceEnterpriseAvailable in public preview
Dashboards and visualizations
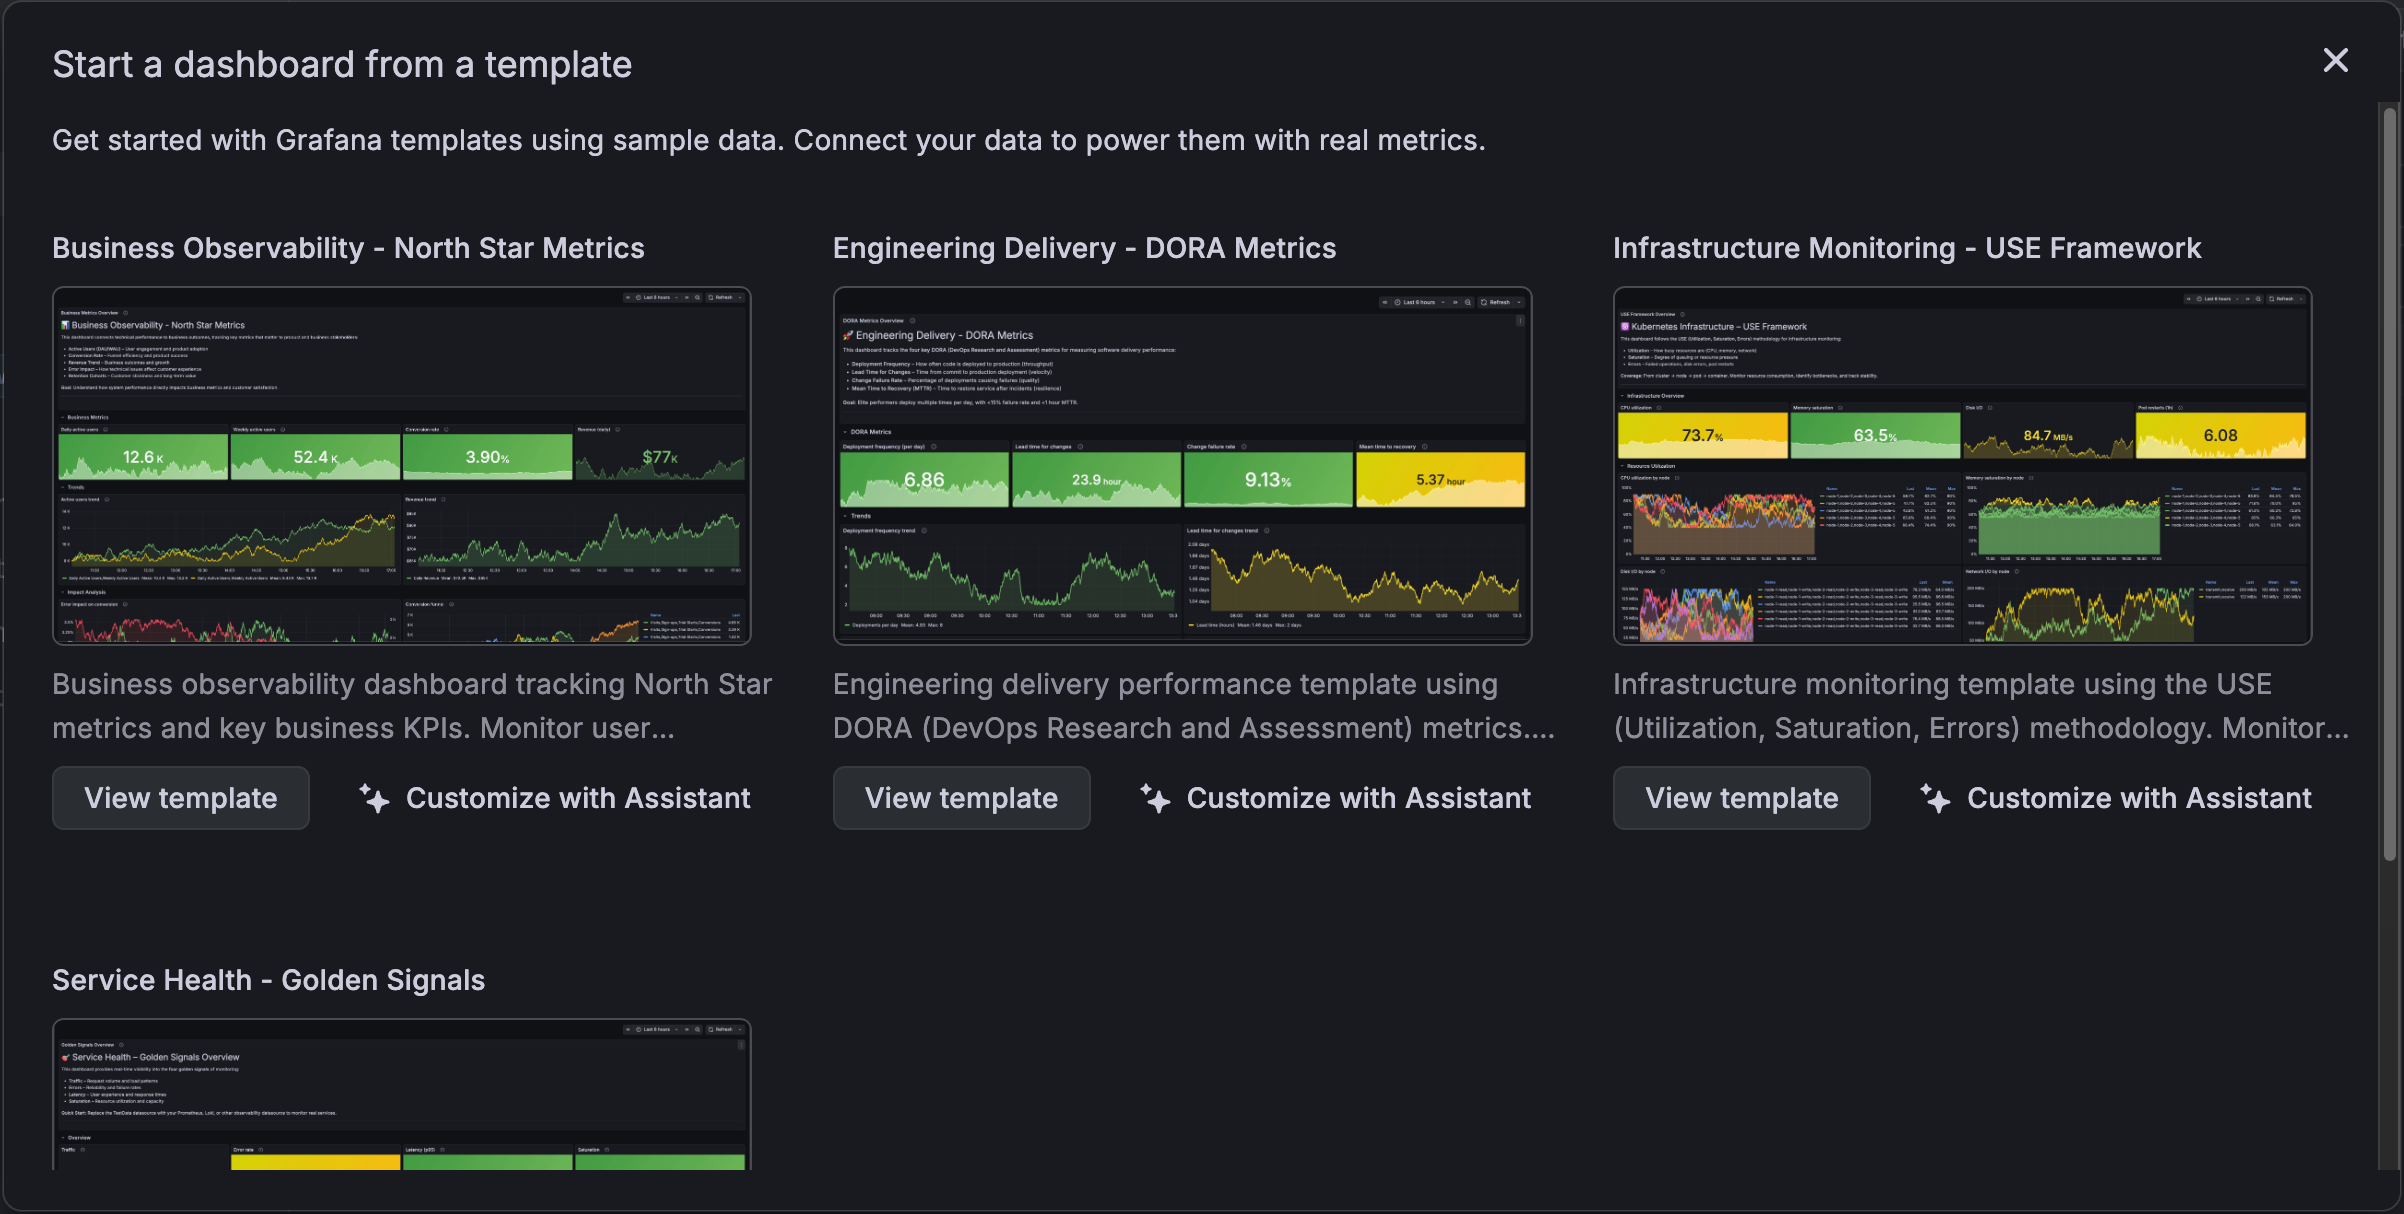
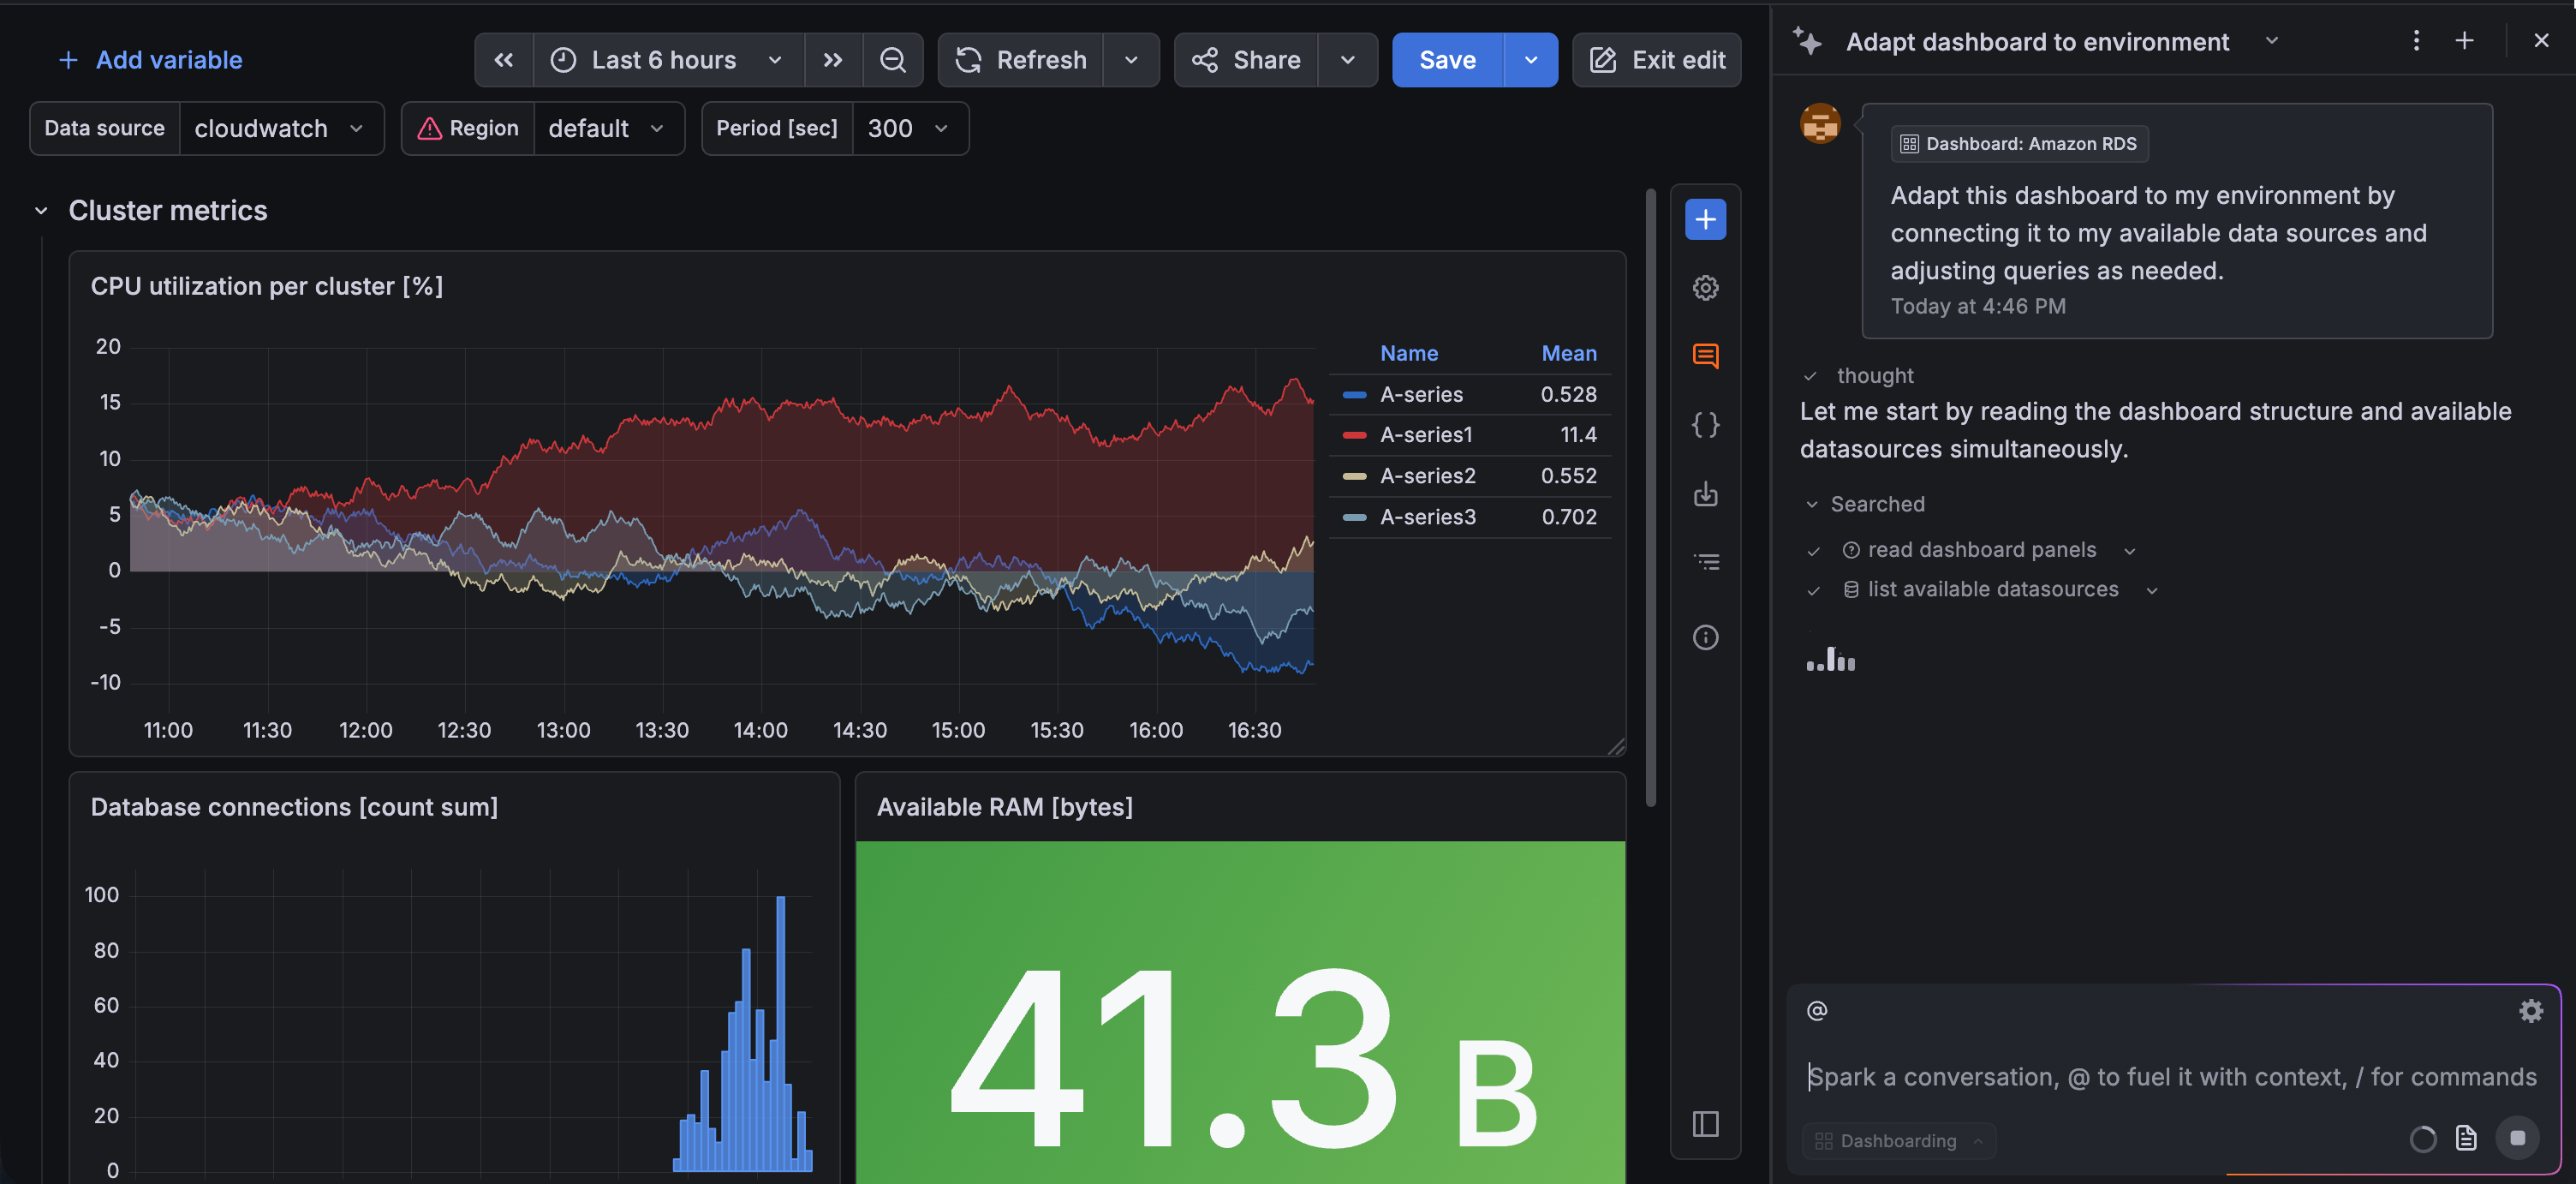
You can now customize suggested dashboards directly with Grafana Assistant, making it easier to turn recommendations into dashboards tailored to your environment.
When you build a dashboard from a data source, you’ll see a Customize with Assistant option when you hover your cursor over a suggestion. This launches Grafana Assistant with a preconfigured prompt that guides you through adapting the selected dashboard:
Grafana CloudAvailable in public previewEnterpriseAvailable in public preview
Dashboards and visualizations
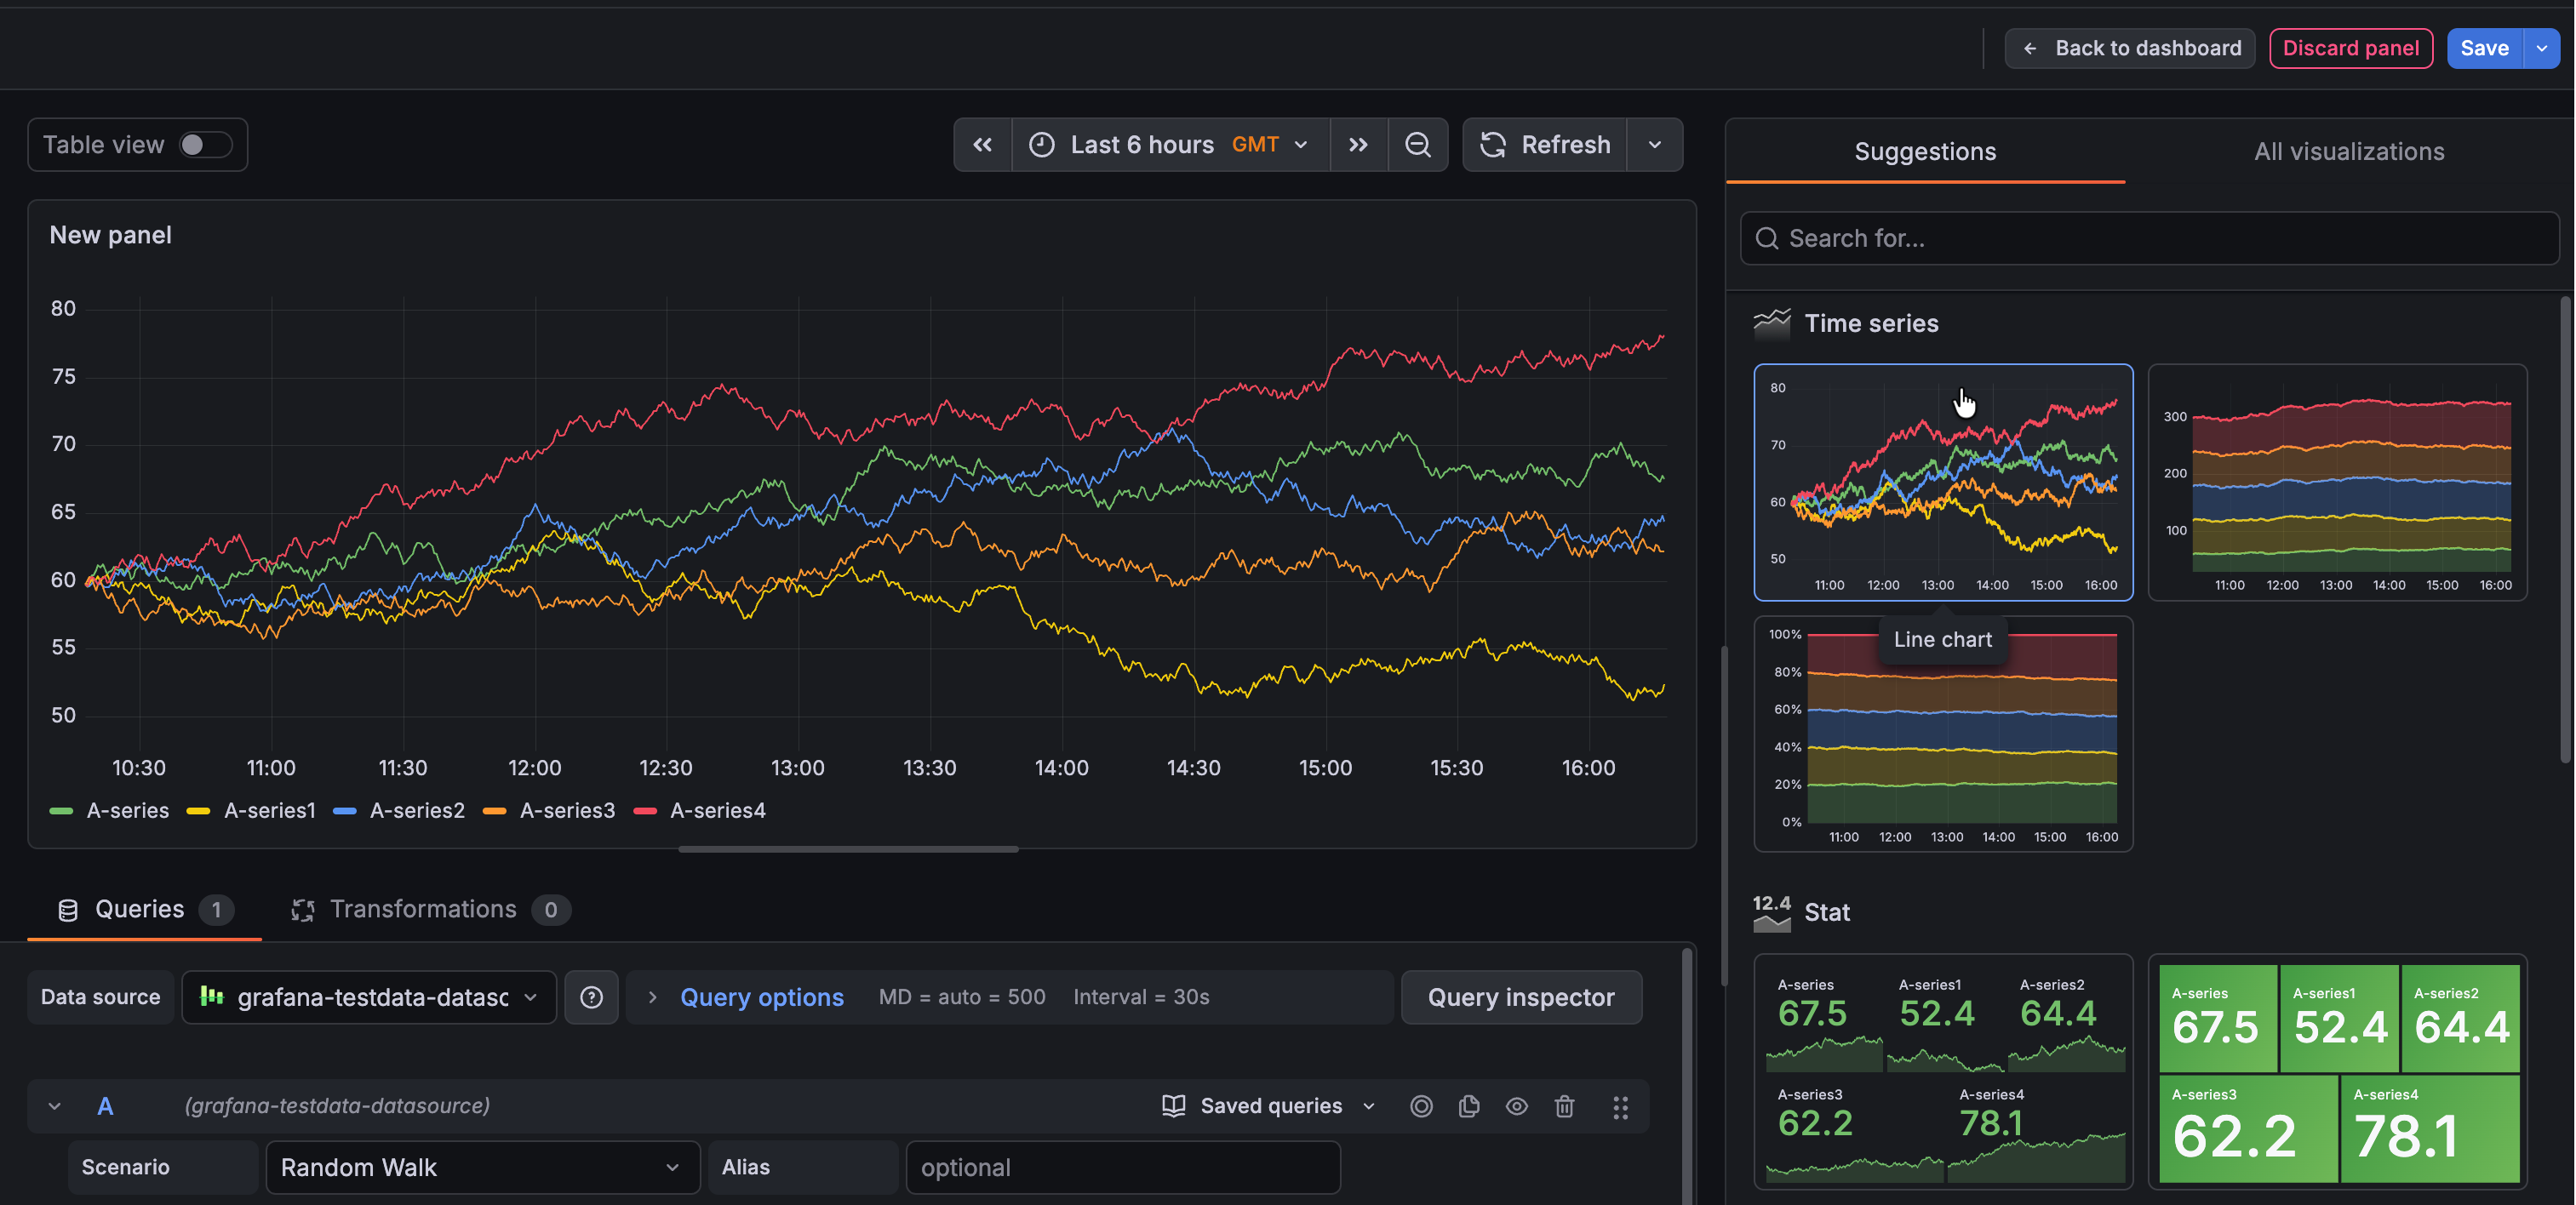
We’ve redesigned the panel configuration experience to include the option to use a saved query.
When you add a panel to a dashboard, you now have three starting points: an empty panel, a library panel, or a saved query. Select Use saved query to open the Saved queries dialog box and choose a query. Grafana then generates a ready-to-edit panel—including a recommended visualization—so you can add a useful panel to your dashboard without even entering panel edit mode:
Grafana CloudAvailable in public previewEnterpriseAvailable in public preview
Dashboards and visualizations
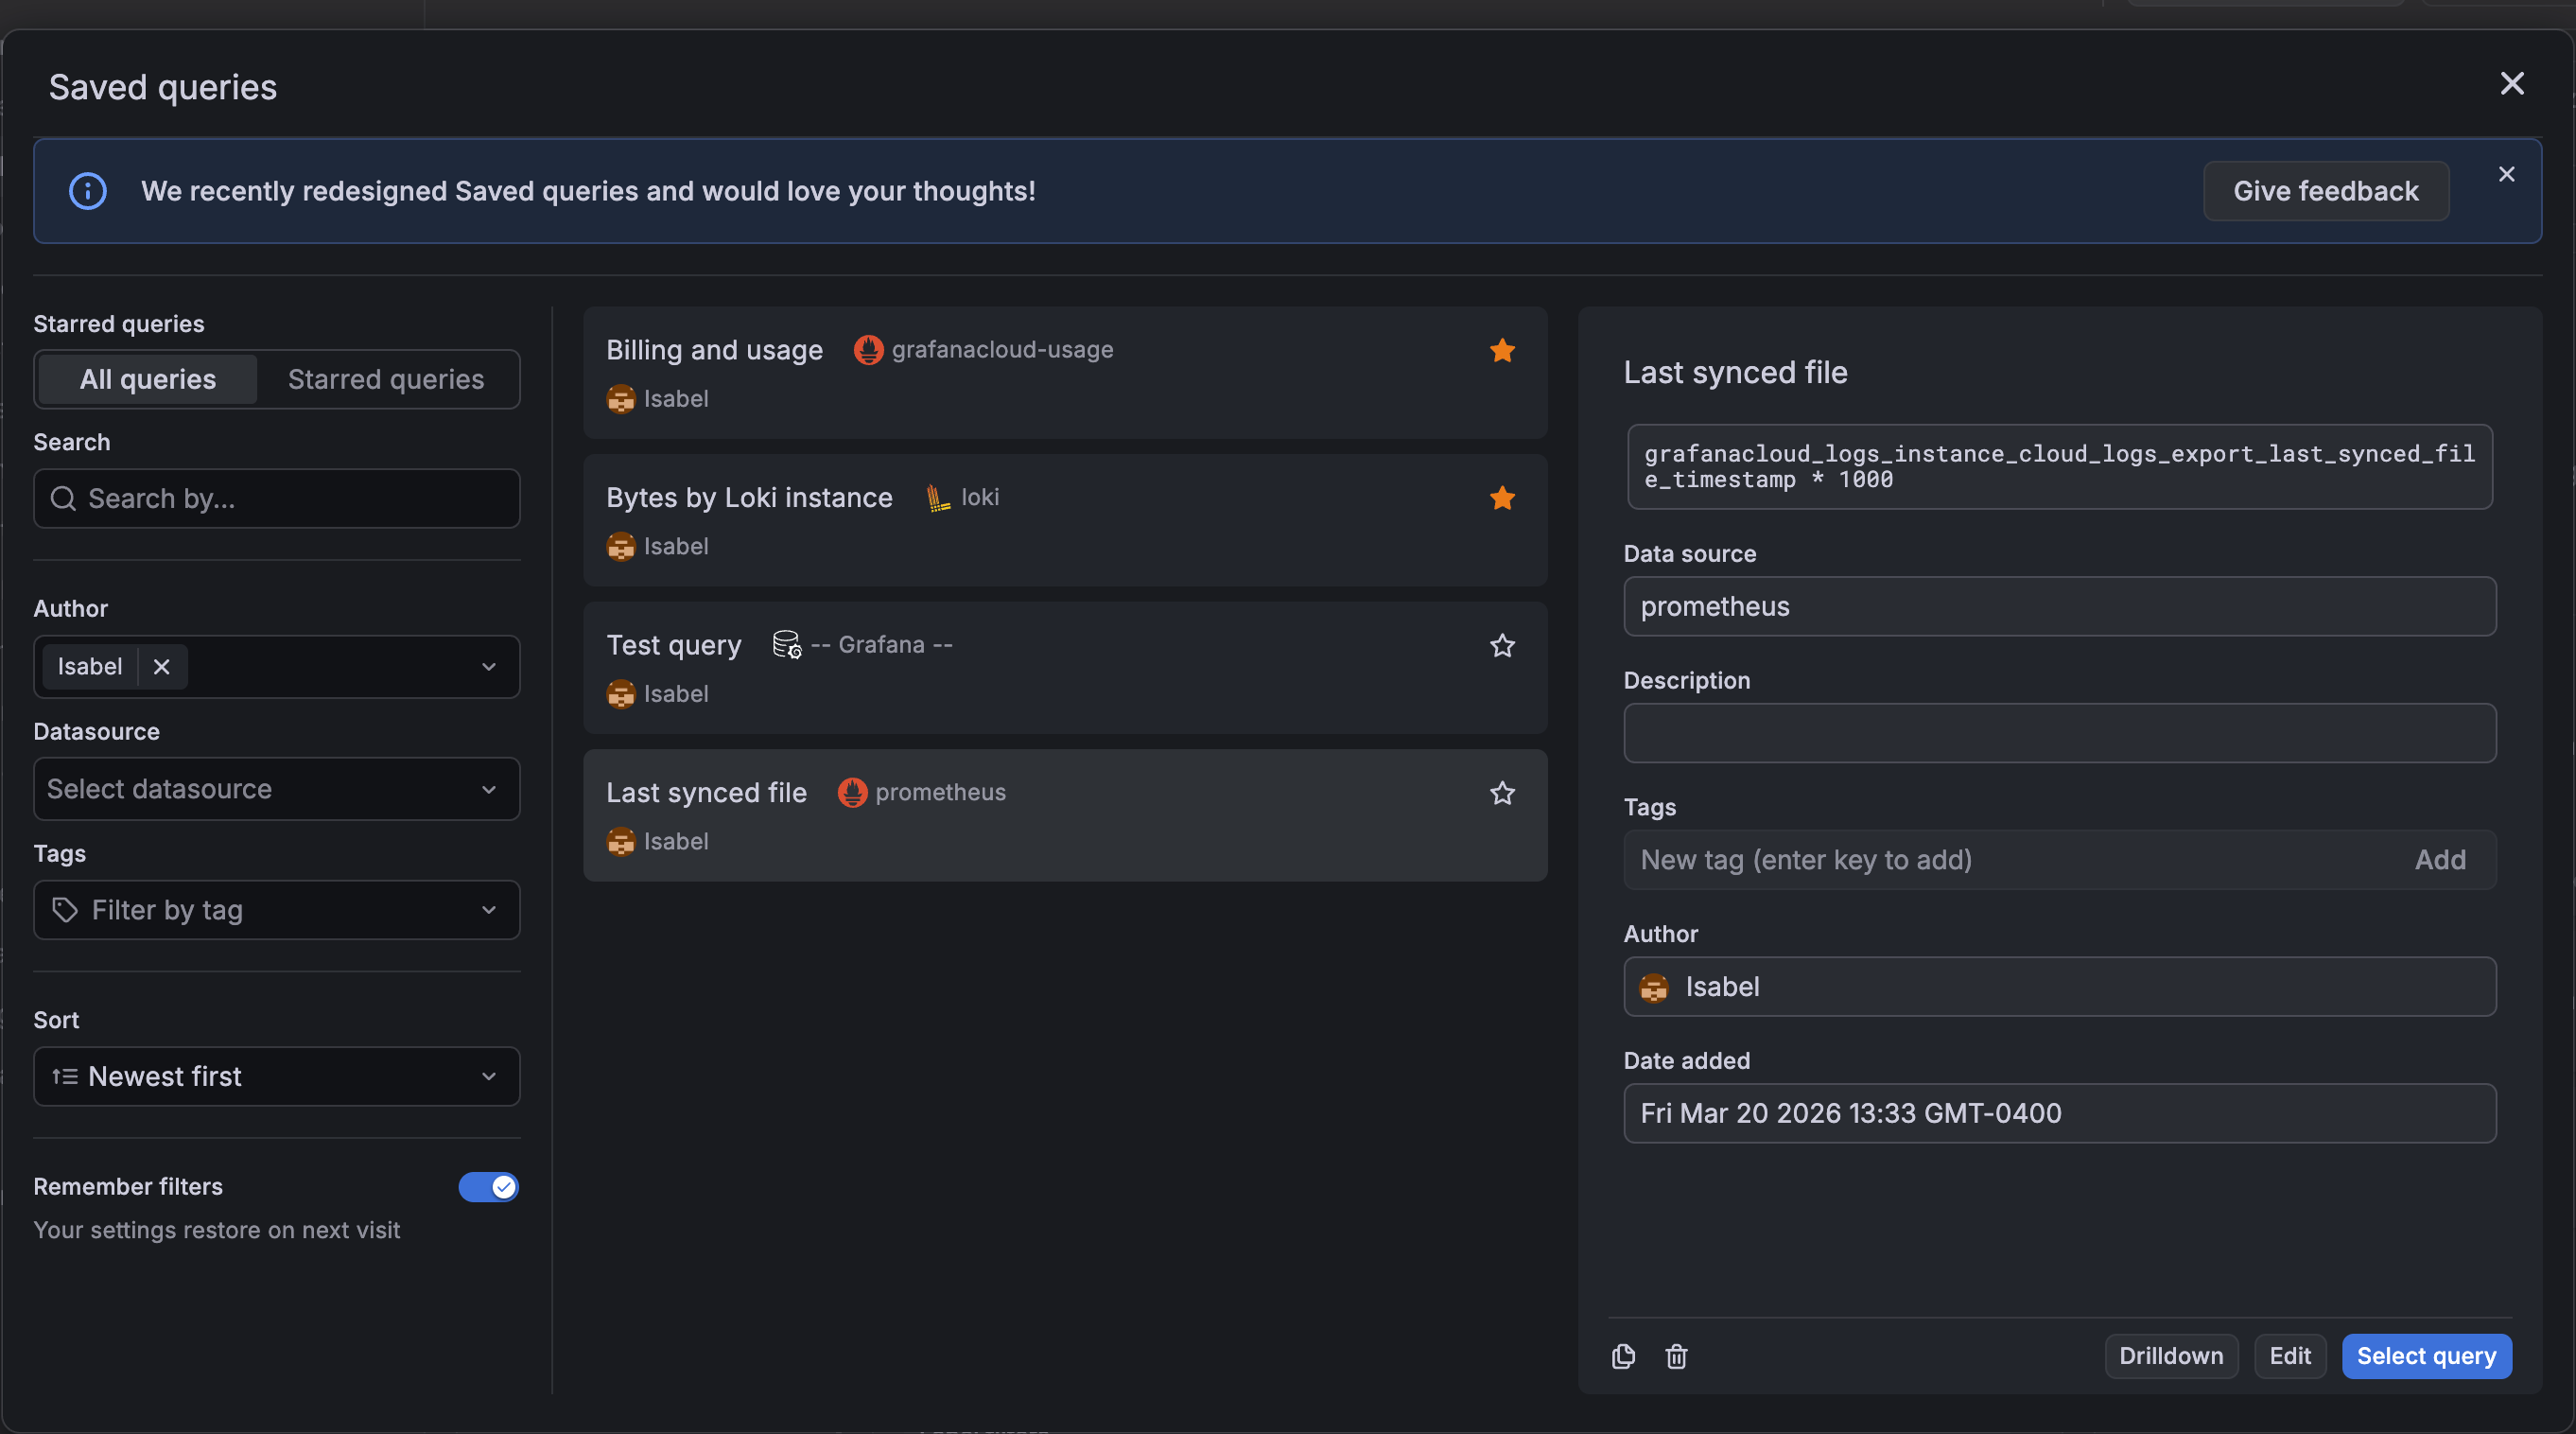
We’ve updated the saved queries experience to improve usability.
The Saved queries drawer has been replaced with a dialog box, providing more space for query titles, data source names, and other query details. The individual query cards also have a refreshed design, allowing for easier readability.
Grafana CloudGenerally AvailableOpen sourceEnterpriseGenerally Available
Dashboards and visualizations
In January 2026, we announced improvements to visualization suggestions in public preview. These changes included higher quality suggestions leveraging information provided by data sources, as well as minor user interface updates. These improvements are now generally available.
Grafana CloudAvailable in private previewOpen sourceEnterpriseAvailable in private preview
Dashboards and visualizations
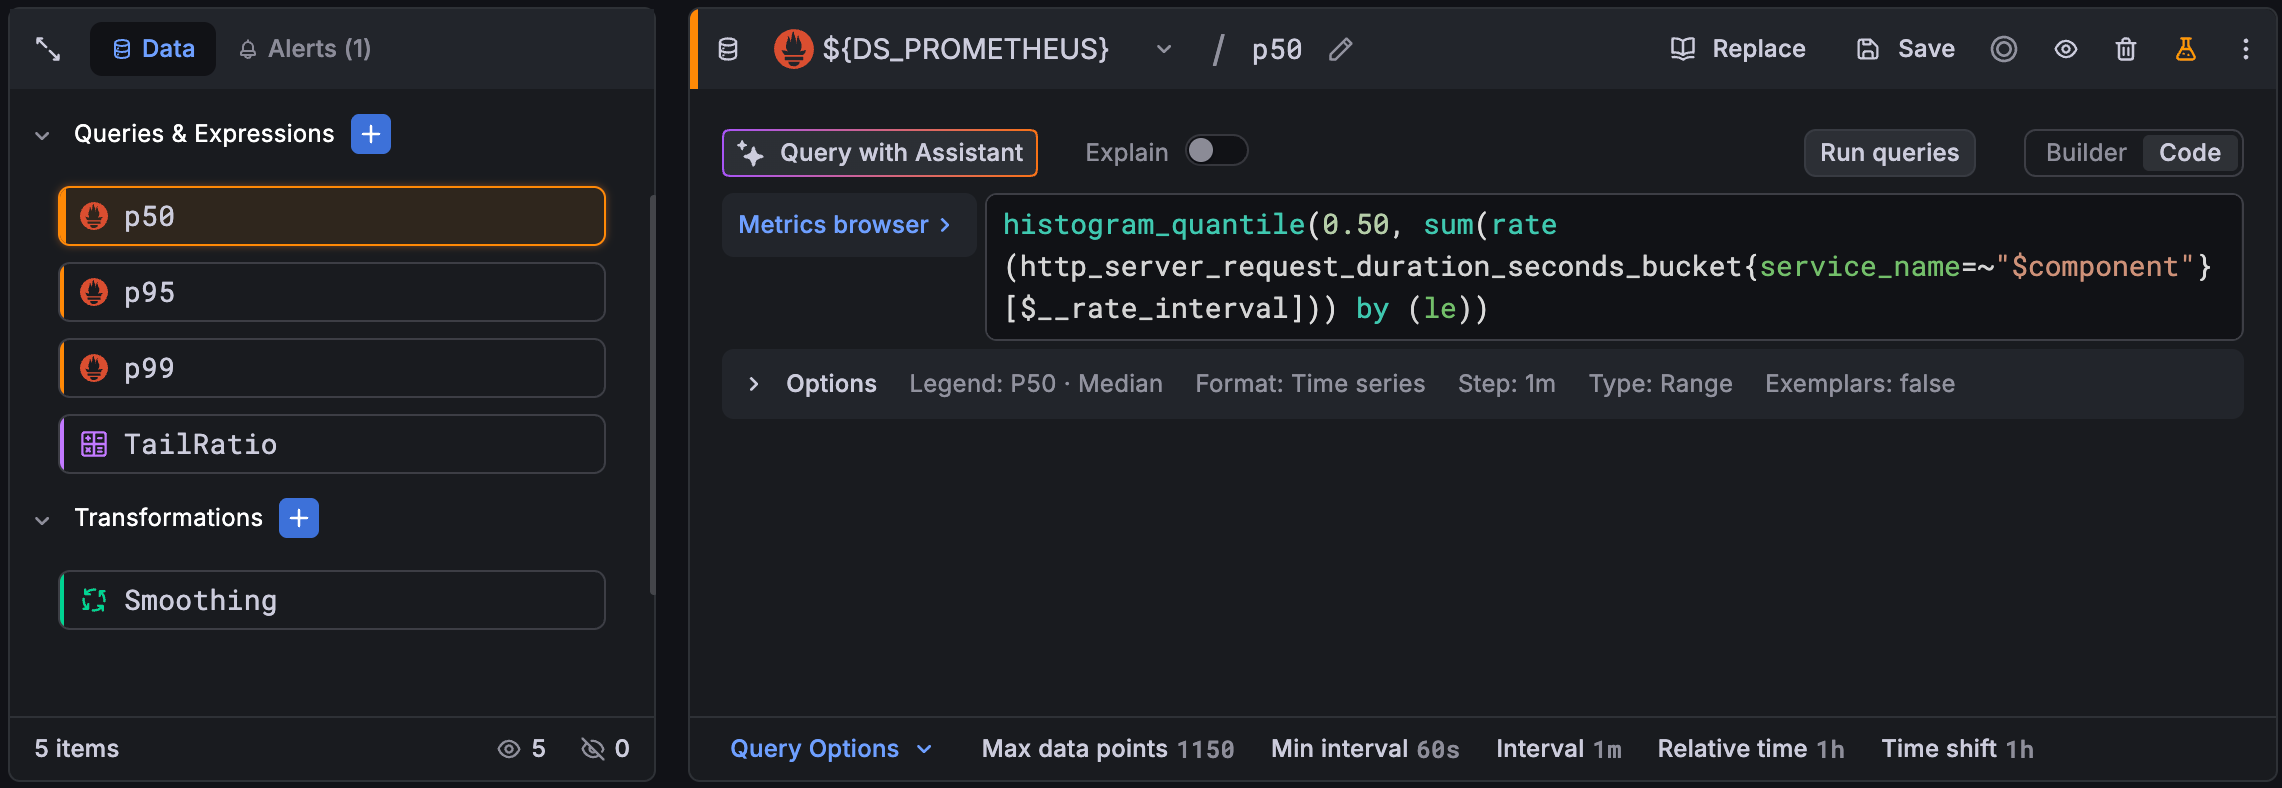
We’ve redesigned the query editor to make complex panels easier to build and manage. The new experience provides a unified view of your entire data pipeline—queries, expressions, transformations, and related alerts—with clearer visual feedback and faster access to the settings that matter.
Grafana CloudAvailable in public previewOpen sourceEnterpriseAvailable in public preview
AI
Today, we announce that access to Assistant now extends to Grafana Enterprise and Grafana OSS users. This makes Grafana Assistant available in your self-managed environment to help you analyze telemetry data and code in real time, build dashboards, ask questions, and more. Self-managed Grafana users can create a Grafana Cloud account and connect it to their Grafana installation via a one-click setup.
Grafana CloudGenerally AvailableOpen sourceEnterpriseAvailable in public preview
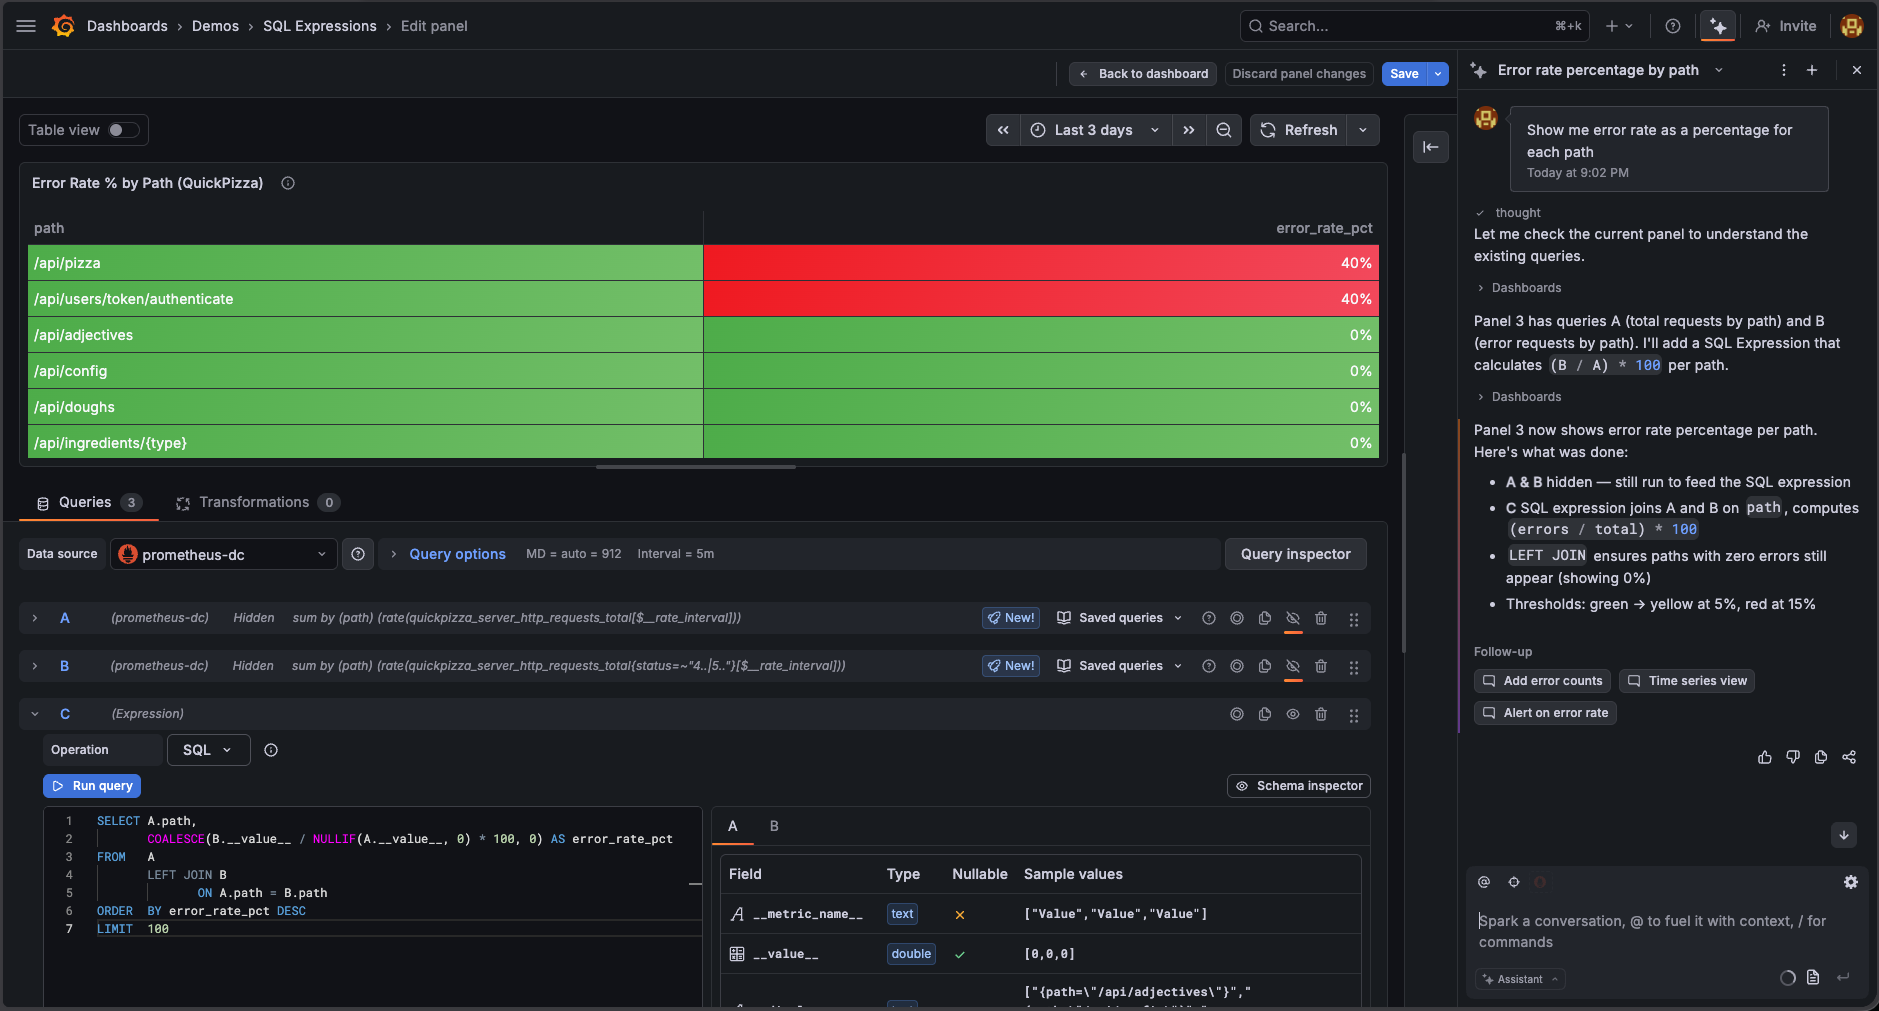
AIDashboards and visualizations
SQL Expressions let you combine and transform data across multiple queries using familiar SQL-joining results, computing ratios, and filtering before aggregating. But to use it, you had to know the feature existed, learn that your query names become table names, and get the MySQL-dialect syntax right yourself.
Grafana CloudExperimentalOpen sourceEnterpriseGenerally Available
Data sourcesExplore
Go beyond the visual query builder in Elasticsearch with a new raw query editor and support for two query languages: Elasticsearch Query DSL and ES|QL.
Grafana CloudAvailable in public previewEnterpriseAvailable in public preview
Data sources
At Grafana, we believe all data deserves visibility. That’s the heart of our Big Tent philosophy. Whether your data comes from cloud-native systems, modern SaaS tools, or long-standing enterprise databases like IBM DB2, it should be easy to explore and visualize in one place. For many organizations, DB2 powers some of their most critical systems. Now, you can bring that data directly into Grafana and see it alongside the rest of your telemetry.
You can use Advisor to uncover issues affecting the health of your Grafana instances, such as:
Data sources with a failing health check that will result in failed queries
Outdated plugins, which might be insecure or lacking the latest fixes and features
Misconfigured SSO settings
Checks run once a week by default and can be triggered manually from the Advisor home page. You can also configure alerts to inform you when new issues arise.
Grafana CloudGenerally AvailableOpen sourceEnterpriseGenerally Available
Alerting
The grafana.com/provenance annotation on alerting notification resources is now correctly
read and enforced when writing using the Kubernetes-style API. Previously, provenance was
hardcoded to none on all Kubernetes API writes, so the annotation was silently ignored. It is now respected. Setting it requires one of the following permissions:
Grafana CloudGenerally AvailableOpen sourceEnterpriseGenerally Available
Grafana is moving to /apis, an API layer that powers the App Platform and gives us a more consistent, scalable foundation going forward. With Grafana 13, we are officially deprecating the /api path in favor of the new /apis path. Deprecating /api marks our commitment to this new model.
Grafana CloudGenerally AvailableOpen sourceEnterpriseGenerally Available
In Grafana v11, we enabled Scenes-powered architecture for dashboards, however the feature could still be disabled. In this release, we’ve removed the the ability to disable Scenes.
In Grafana 12.2.0, we introduced two new settings for controlling audit log emission for data source queries: log_datasource_query_request_body and log_datasource_query_response_body, which logs the request and response body payloads respectively.
Open sourceEnterpriseGenerally Available
Dashboards and visualizationsBreaking change
Warning
Git Sync early adopters: A migration bug in Grafana v13.0.0 might cause dashboards and folders to be lost or reverted when upgrading from Grafana v12.x.x with Git Sync enabled. Upgrading from v13.0.0 to v13.0.1 does not recover lost data, and if you already upgraded, you must restore your database first, then upgrade to v13.0.1.
Open sourceEnterpriseGenerally Available
ReportingBreaking change
Previously, the Image Renderer authenticated with Grafana instances by using opaque tokens stored in the Grafana database in order to navigate to panels and dashboards to generate screenshots and PDFs.
Grafana CloudGenerally AvailableOpen sourceEnterpriseGenerally Available
Breaking change
The config.apps and config.panels properties from the @grafana/runtime package are deprecated and scheduled for removal in Grafana 13.2.0, scheduled for the second half of 2026.
Open sourceEnterpriseGenerally Available
Breaking change
The grafana-cli and grafana-server commands were deprecated in Grafana v10.0 in favor of the grafana cli and grafana server commands. Until now, both sets of commands were usable.
Open sourceEnterpriseGenerally Available
Data sourcesBreaking change
Data source APIs that referenced data sources using a numeric id were deprecated in Grafana v9.0 in favor of APIs that reference data sources using a uid instead. In Grafana v13.0, these deprecated APIs are disabled by default.
Open sourceEnterpriseGenerally Available
Breaking change
Previously, the enable_gzip configuration option in the [server] section of the Grafana configuration file, which enables HTTP compression, was disabled by default with the recommendation that most users manually enable it. Starting in Grafana v13.0, this setting is enabled by default.
Grafana CloudGenerally AvailableOpen sourceEnterpriseGenerally Available
Breaking changeAlerting
The GET /api/alertmanager/grafana/api/v2/status endpoint previously required the legacy alert.notifications:read permission. It now requires a dedicated alert.notifications.system-status:read permission. This new permission is included in the fixed:alerting.notifications:writer role, which is granted to Admin users by default.
Grafana CloudGenerally AvailableOpen sourceEnterpriseGenerally Available
Breaking changeAlerting
In Grafana v12.0, we deprecated several Alertmanager configuration API endpoints that rely on legacy single-tenant Alertmanager configuration semantics. In Grafana v13.0 we are removing or restricting access to them:
Grafana CloudGenerally AvailableOpen sourceEnterpriseGenerally Available
Breaking changeData sources
Grafana v13.0 upgrades the core application from React 18 to React 19. The SceneViewer panel in the IoT TwinMaker app (grafana-iot-twinmaker-app) depends on React APIs removed in React 19 and will fail to render after upgrading.
Grafana CloudGenerally AvailableEnterpriseGenerally Available
Breaking change
Grafana 13 tightens RBAC enforcement for custom roles, Terraform-managed roles, and role provisioning. Most users aren’t affected. If you maintain custom RBAC roles, especially roles with data source permissions scoped to specific UIDs, or roles using legacy annotation scopes, review your role definitions now to prevent errors.