Troubleshoot dashboards
Note: Looking for prebuilt Grafana dashboards? Check out our full library of dashboards and more →
Use the following strategies to help you troubleshoot common dashboard problems.
Dashboard is slow
- Are you trying to render dozens (or hundreds or thousands) of time series on a graph? This can cause the browser to lag. Try using functions like
highestMax(in Graphite) to reduce the number of returned series. - Sometimes series names can be very large. This causes larger response sizes. Try using
aliasto reduce the size of the returned series names. - Are you querying many time series or a long time range? Both of these conditions can cause Grafana or your data source to pull in a lot of data, which may slow the dashboard down. Try reducing one or both of these.
- There could be high load on your network infrastructure. If the slowness isn’t consistent, this may be the problem.
Dashboard refresh rate issues
By default, Grafana queries your data source every 30 seconds. However, setting a low refresh rate on your dashboards puts unnecessary stress on the backend. In many cases, querying this frequently isn’t necessary because the data source isn’t sending data often enough for there to be changes every 30 seconds.
We recommend the following:
- Only enable auto-refreshing on dashboards, panels, or variables if necessary. Users can refresh their browser manually.
- If you require auto-refreshing, then set the refresh rate to a longer time period that makes sense, such as once a minute, every 10 minutes, or every hour.
- Check the time range of your dashboard. If your dashboard has a longer time range, such as a week, then you really don’t need automated refreshing and you should disable it.
Handling or rendering null data is wrong or confusing
Some applications publish data intermittently; for example, they only post a metric when an event occurs. By default, Grafana graphs connect lines between the data points, but this can be deceptive.
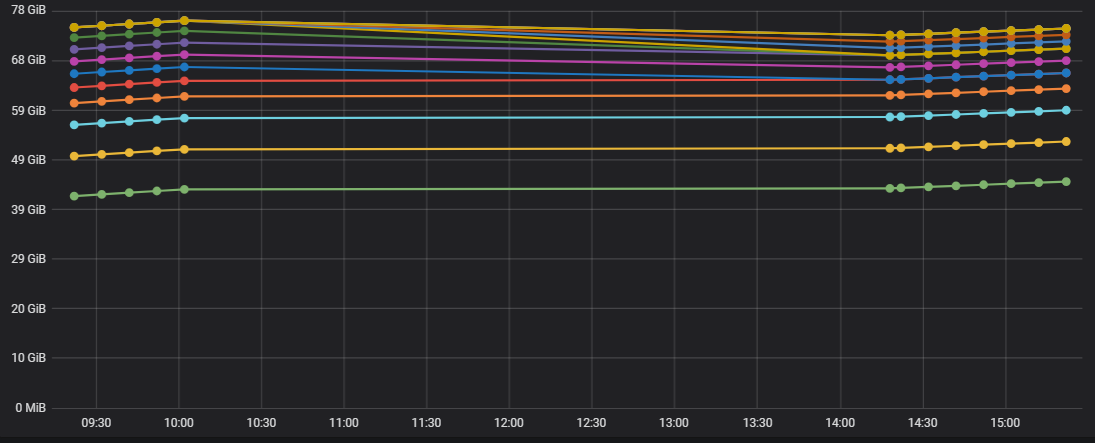
The graph in the following image has:
- Points and 3-point radius enabled to highlight where data points are actually present.
- Connect null values set to Always.
The graph in this next image shows bars instead of lines and has the No value option under Standard options set to 0.
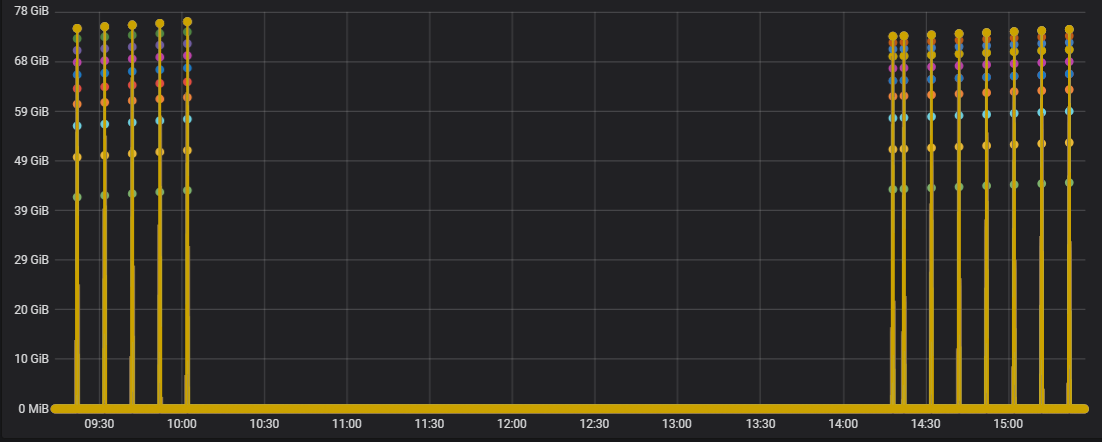
As you can see, there’s a significant difference in the visualizations.
Tooltip doesn’t stay open when clicked
If you click a data point expecting the tooltip to stay open so you can scroll or copy its content, but the tooltip immediately disappears or resets, the Refresh live dashboards setting is likely the cause.
When you enable Refresh live dashboards on a dashboard, Grafana continuously re-renders panels as data arrives. If the refresh interval is too low, each re-render dismisses any pinned tooltip before you can interact with it.
To fix this, do one of the following:
- Disable live refresh: Open the dashboard settings, go to General, and toggle off the Refresh live dashboards switch. Tooltips remain open on click after the next render cycle.
- Increase the refresh interval: If you need live updates, open the dashboard settings, go to General, and increase the Auto refresh value. This provides enough time between dashboard re-renders for the tooltip to remain open.


