What's new from Grafana Labs
Troubleshooting enhancements in Kubernetes Monitoring
Kubernetes Monitoring has added more troubleshooting tools:
- Find deleted Clusters, Nodes, Pods, containers, workloads, and namespaces
- Zoom into an area on the graph to narrow the time range
- Jump directly to the list of Clusters, Nodes, workloads, and alerts from the home page
Find deleted objects
You can find deleted objects within a 30-day time period, such as a Node shown in this example:

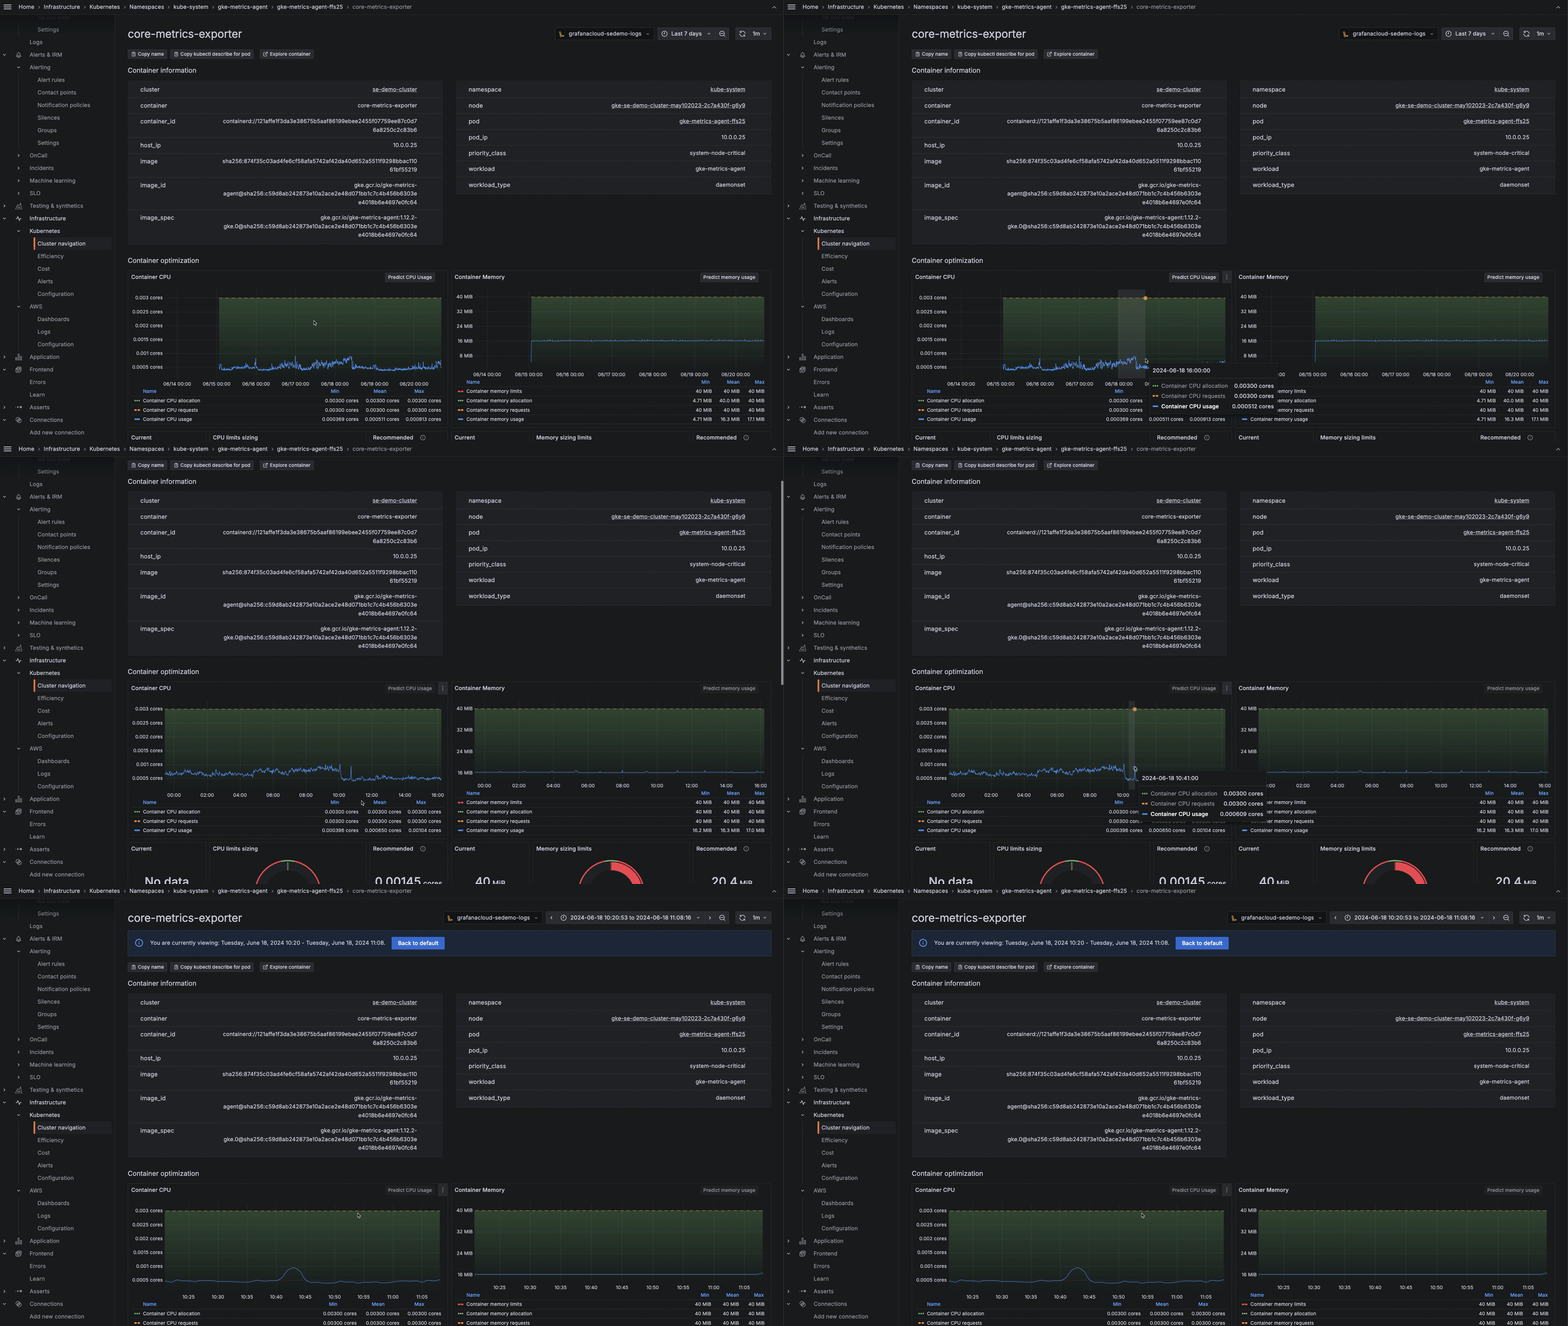
Zoom in to refine a time range
Zoom in on a graph to narrow a time range for more analysis.

Jump directly to Clusters, Nodes, workloads, and alerts
From the home page, you can jump directly to the list of Clusters, Nodes, and workloads.

To go directly to alerts from the Pods in trouble section, click See all alerts.
Related What's new posts