Filter and group by controls
Note
The Filter and Group by feature renames the Ad hoc filters variable and extends it by adding grouping for Prometheus and Loki data sources. However, in the dashboard schema, it’s still referred to as
"kind": "AdhocVariable"under thevariablesschema property.
The Filter and Group by option is one of the most complex and flexible dashboard controls available. Instead of creating a variable for each dimension by which you want to filter, it automatically queries your data source for available dimensions and lets users add or remove filters and group by dimensions on the dashboard dynamically. This allows you to quickly apply filters dashboard-wide.
The group by function allows you to then group data by keys, letting you split it up.
This function is typically used with aggregation queries, such as sum(your_metric_here), to split aggregated results by the selected dimensions.
Then, you can use filters within panels to filter data in or out, drilling down further into the data.
The filter and group by feature lets you add label/value filter pairs that are automatically added to all queries that use the specified data source. Unlike variables, you don’t use these filters in queries. Instead, you use them to write filters for existing queries.
The following data sources support filters. Data sources with an asterisk also support the group by function:
- Prometheus*
- Loki*
- InfluxDB
- Elasticsearch
- OpenSearch.
- Special Dashboard data source - Use this special data source to apply filters to data from unsupported data sources.
Add filters and group by controls
To add filters and group by controls, follow these steps:
Navigate to the dashboard you want to update.
Click Edit.
Click the Add new element icon (blue plus sign).
Click Filter and Group by.
Enter a Name for the filter.
(Optional) In the Label field, enter the display name for the filter drop-down list.
If you don’t enter a display name, then the drop-down list label is the filter name.
(Optional) In the Description field, enter a description of the filter. The description appears as an info icon tooltip next to the filter name on the dashboard.
Descriptions support links. You can use Markdown-style links (
[link text](https://example.com)) or paste bare URLs (https://example.com). OnlyhttpandhttpsURLs are rendered as clickable links—other protocols are displayed as plain text.Choose a Display option:
- Above dashboard: The filter drop-down list displays above the dashboard with the filter Name or Label value. This is the default.
- Above dashboard, label hidden: The filter drop-down list displays above the dashboard, but without showing the name of the filter.
- Controls menu: The filter is displayed in the dashboard controls menu instead of above the dashboard. The dashboard controls menu appears as a button in the dashboard toolbar.
- Hidden: No filter drop-down list is displayed on the dashboard.
Under the Filter options section of the page, set the following options:
Click Save.
Enter an optional description of your dashboard changes, and then click Save.
Click Exit edit.
Now you can filter and group data on the dashboard.
You can remove and reset default filters and group by dimensions, and see your recent ones:


To see all active filters and group by dimensions across the dashboard all at once, click the Filters overview icon (filter) in the toolbar to open an overview. The overview lets you search for specific keys, and adjust them, without scrolling through the dashboard controls:
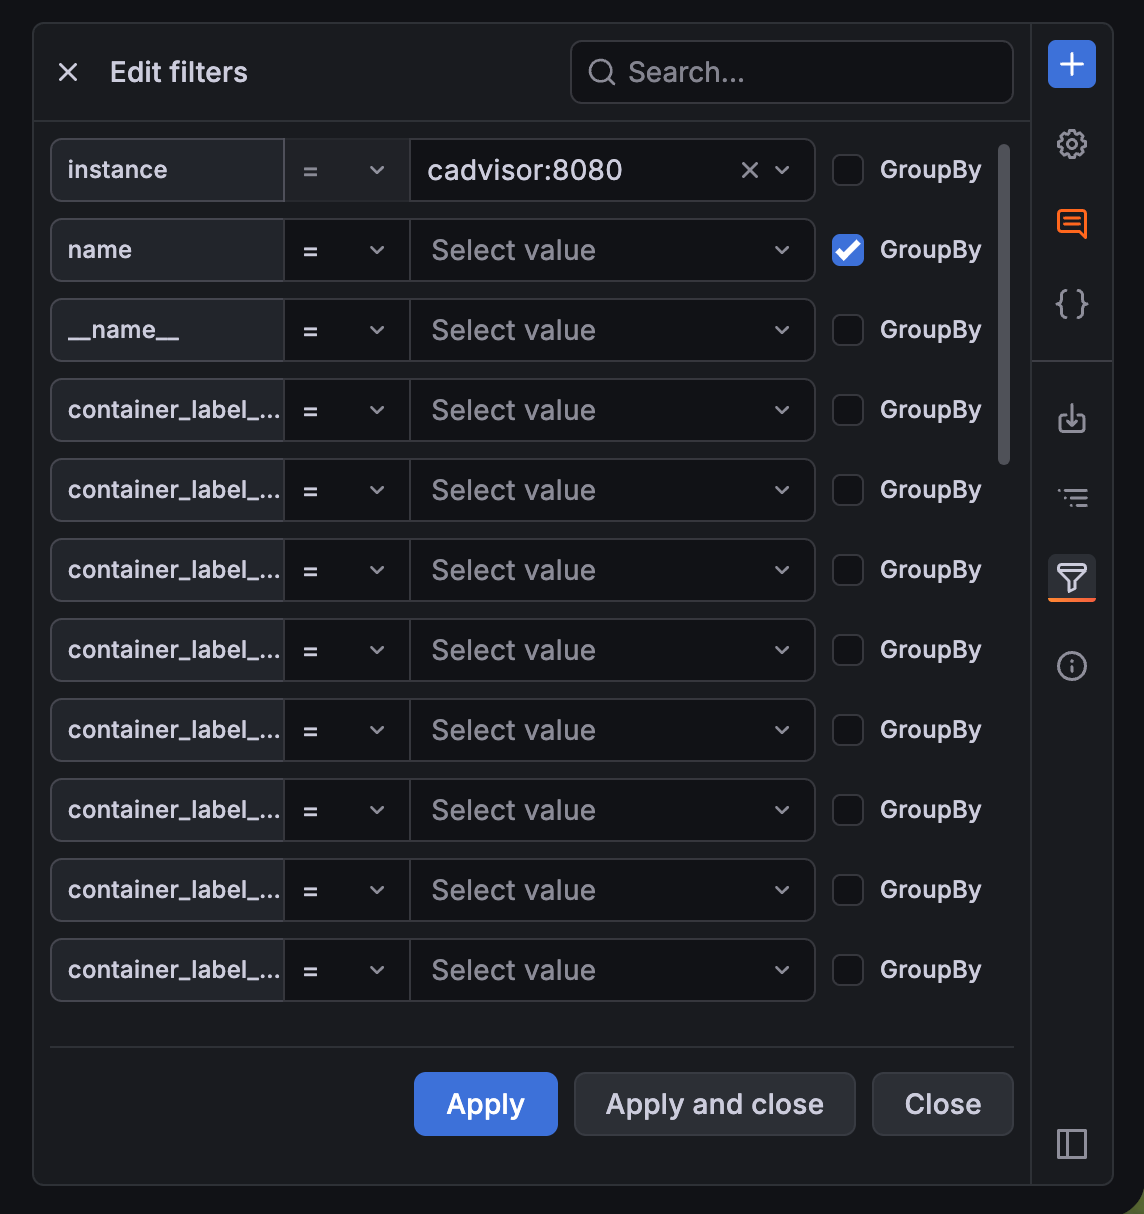
Add an operator and value for a key to add it as a filter or select the Group by checkbox to set a group by dimension. You can use a key for both a filter and a group by.
Group and filter from the panel
When the Group by switch is toggled on, you can also set a group by dimension from a panel rather than from the dashboard-level control. Hover the cursor over any panel using the data source of the filter to show the Group by selector:
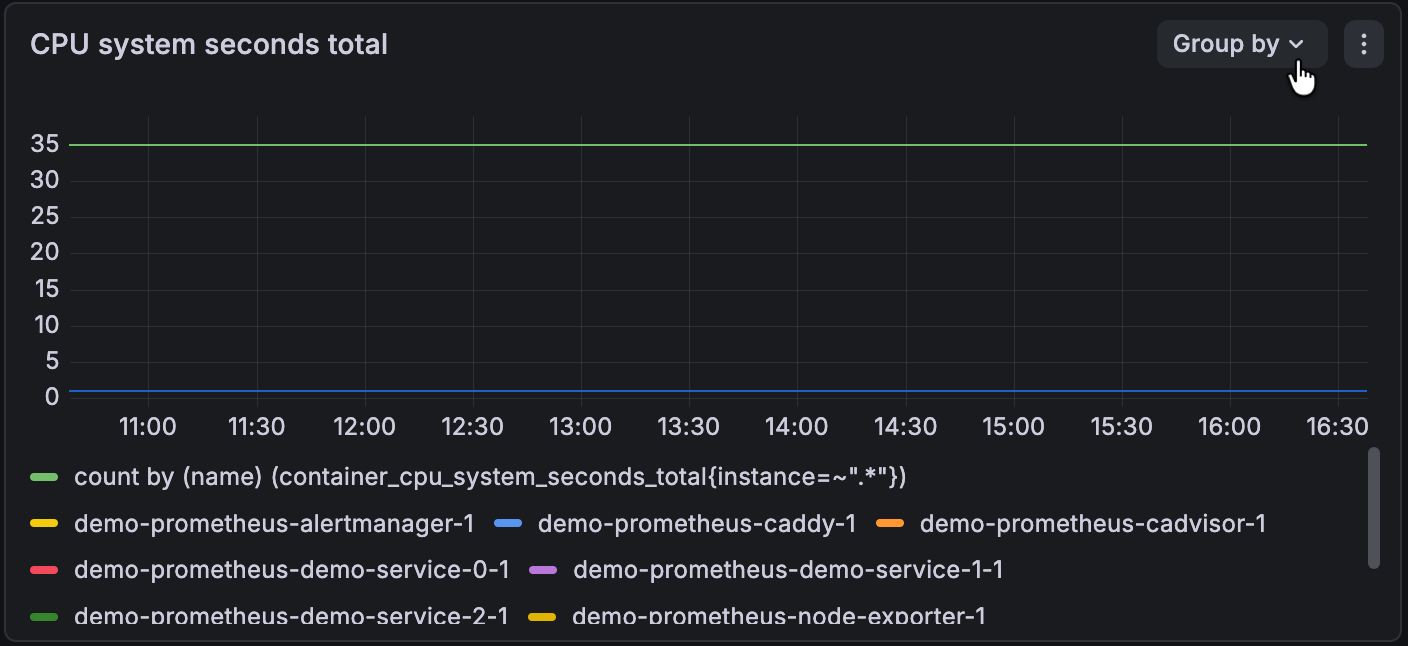
The panel-level Group by control only includes keys available in the panel’s query. This is in contrast with the dashaboard-level control that includes all available keys for the dashboard. Your selection is applied to all the panels in the dashboard with the same data source.
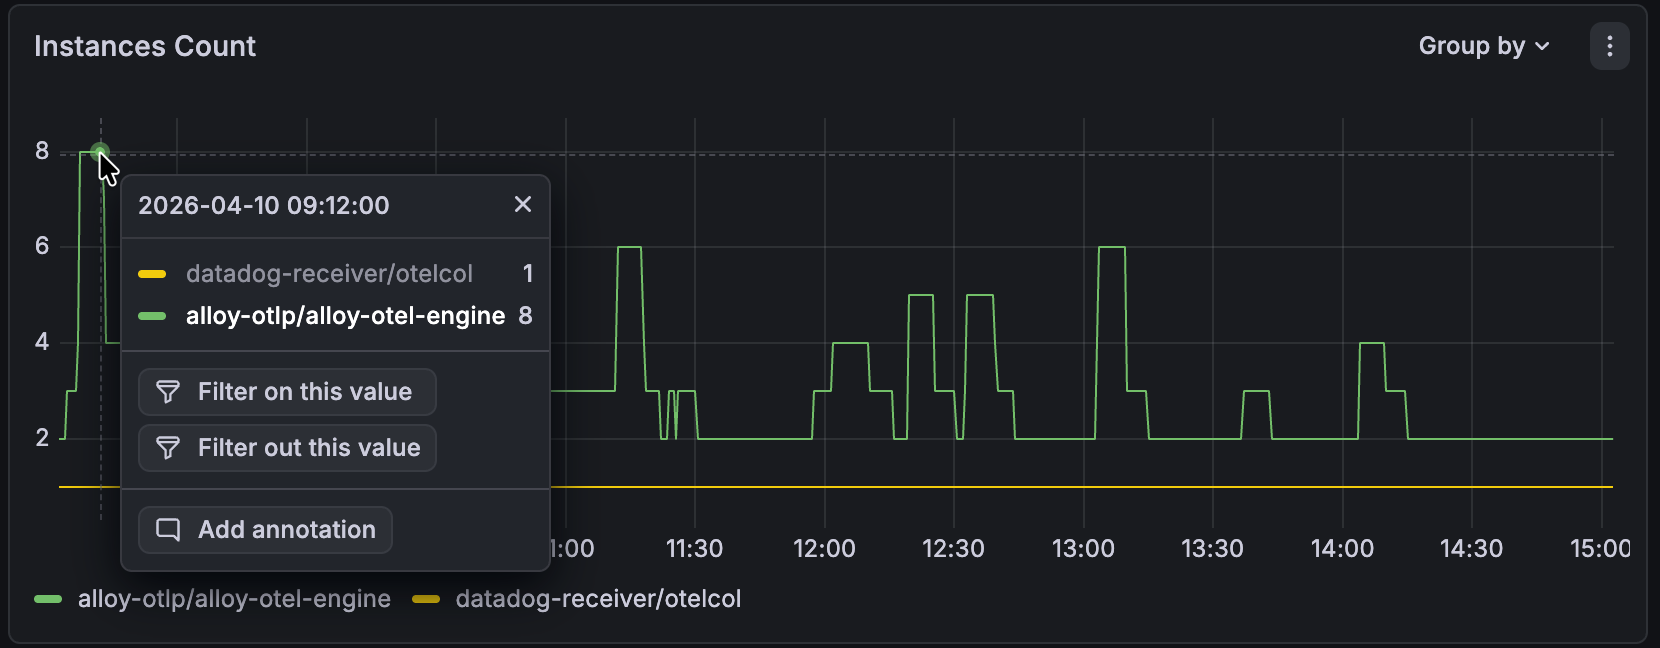
You can also further filter a time series panel, which allows you to drill down further into your data. After setting your group by dimension and splitting your data, click on a series in a panel and click Filter on this value or Filter out this value. This filters by the labels found on that series, which are related to the already set group by dimensions.
To enable this functionality, you need to add one or more overrides for the panel. In the following example, the override:
- Adds a regular expression, so that all fields are filterable
- Enables the Filterable switch
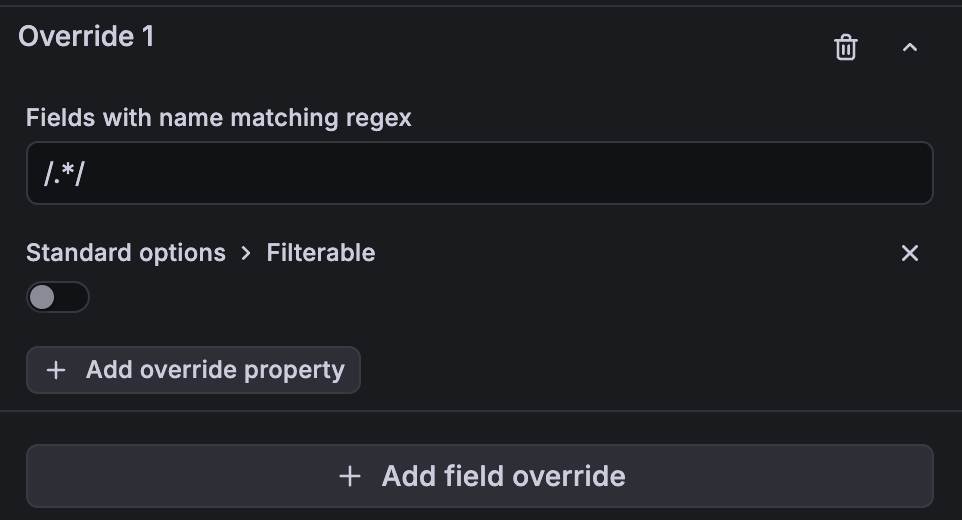
However, you can create overrides to address specific fields.
You can also do this programmatically by returning the data frame with the appropriate filterable property on the desired fields.
With the override in place, you can click a series on a time series panel and filter it in or out. The new filter is shown in the dashboard filter control and the it’s applied to the whole dashboard.
Now you can filter data on the dashboard.
Advanced filtering
After you’ve added filters to a dashboard, you can use them in several ways to explore and refine your data. The following sections explain how to filter data from unsupported data sources, apply filters directly from visualizations, and preserve filters when navigating between panels.
Filter any data using the Dashboard data source
In cases where a data source doesn’t support the use of filters, you can use the Dashboard data source to reference that data, and then filter it in a new panel. This allows you to bypass the limitations of the data source in the source panel.
To use filters on data from an unsupported data source, follow these steps:
Navigate to the dashboard with the panel with the data you want to filter.
Click Edit in top-right corner of the dashboard.
Click the Add new element icon and click or drag a panel onto the dashboard.
Click Configure visualization.
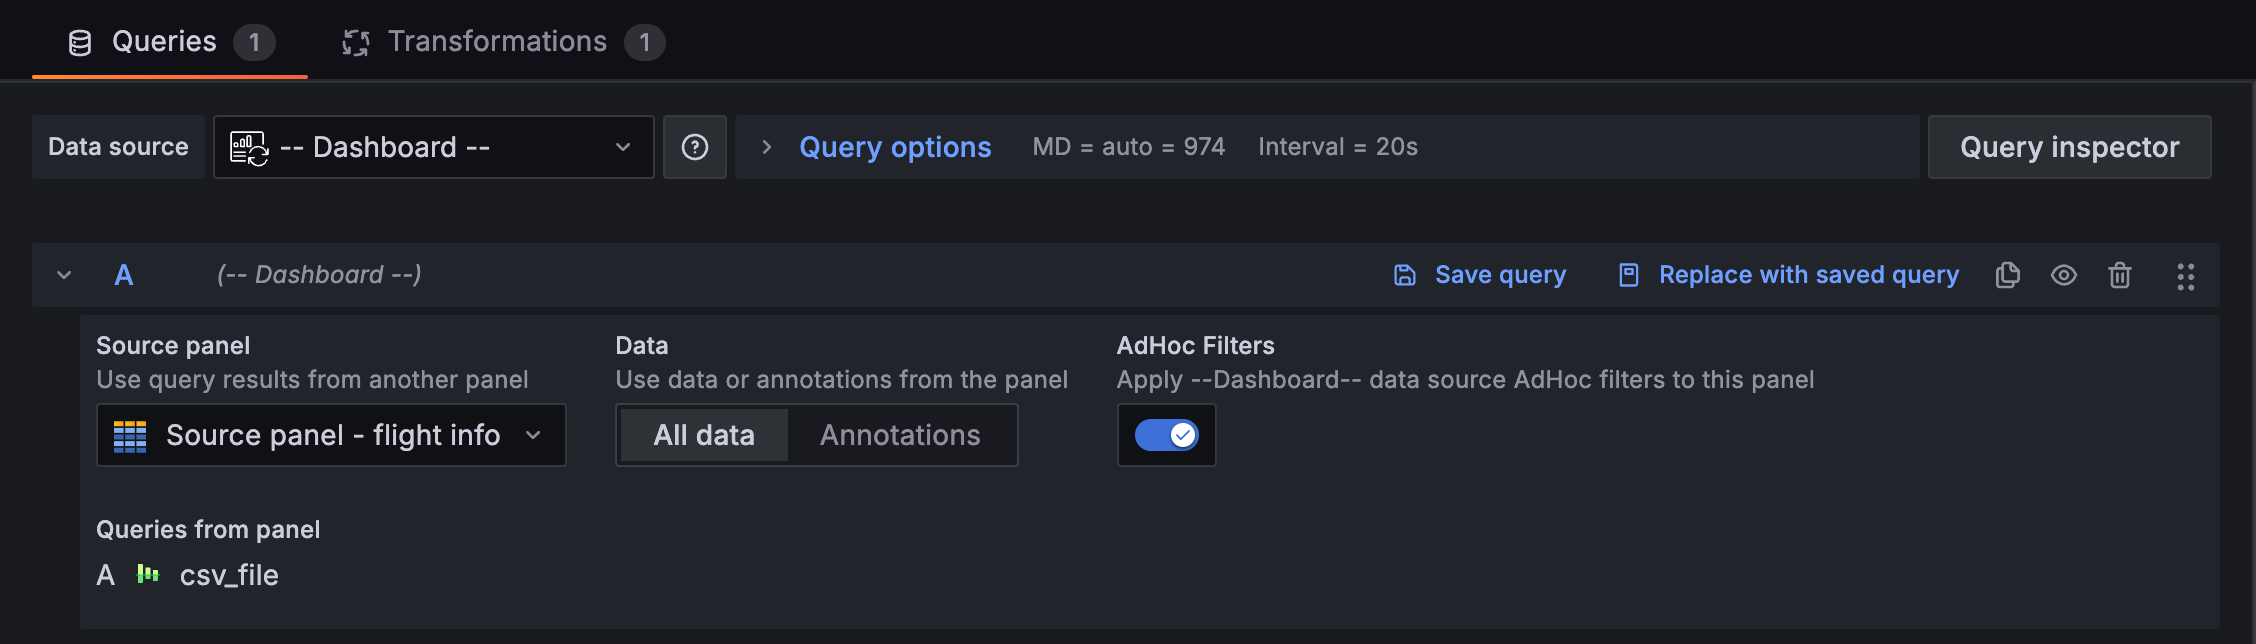
In the Queries tab of the edit panel view, enter
Dashboardin the Data source field and select – Dashboard –.In the query configuration section, make the following selections:
- Source panel - Choose the panel with the source data.
- Data - Select All Data to use the data of the panel, and not just the annotations. This is the default selection.
- Filters - Toggle on the switch to make the data from the referenced panel filterable.
Note
If you’re referencing multiple panels in a dashboard with the Dashboard data source, you can only use one of those source panels at a time for filtering.
Configure any other needed options for the panel.
Click Save in the top-right corner.
Enter an optional description of your changes and click Save.
Click Back to dashboard and then Exit edit.
Now you can filter the data from the source panel by way of the Dashboard data source. Add as many panels as you need.
Dashboard drilldown with filters
In table and bar chart visualizations, you can apply filters directly from the visualization. To quickly apply filter variables, follow these steps:
To display the filter icons, hover your cursor over the table cell with the value for which you want to filter. In this example, the cell value is
ConfigMap Updated, which is in thealertnamecolumn:![Table and bar chart with a filter icon displayed on a table cell]()
In bar chart visualizations, hover and click the bar to display the filter button:
![The filter button in a bar chart tooltip]()
Click the add filter icon.
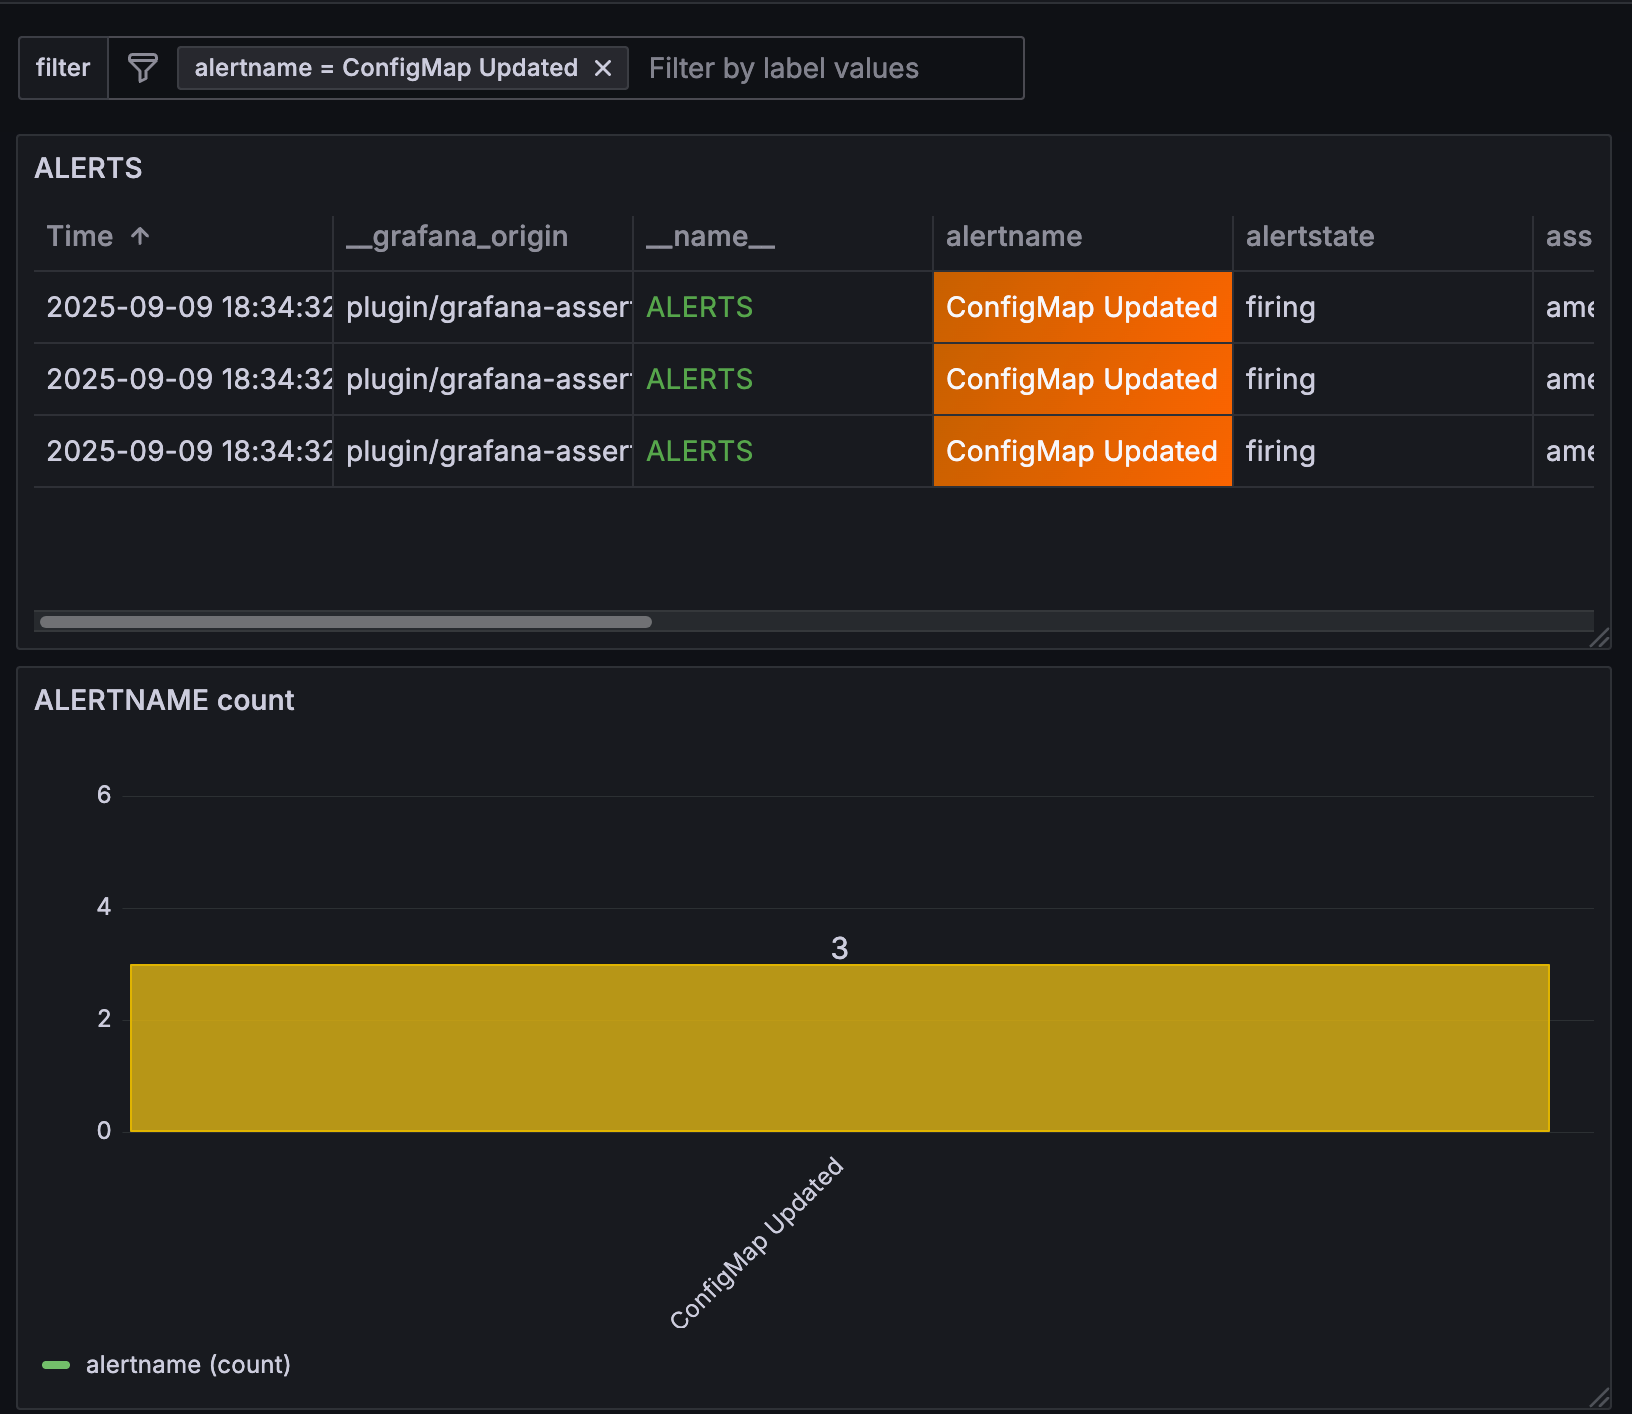
The variable pair
alertname = ConfigMap Updatedis added to the filter and all panels using the same data source that include that variable value are filtered by that value:![Table and bar chart, filtered]()
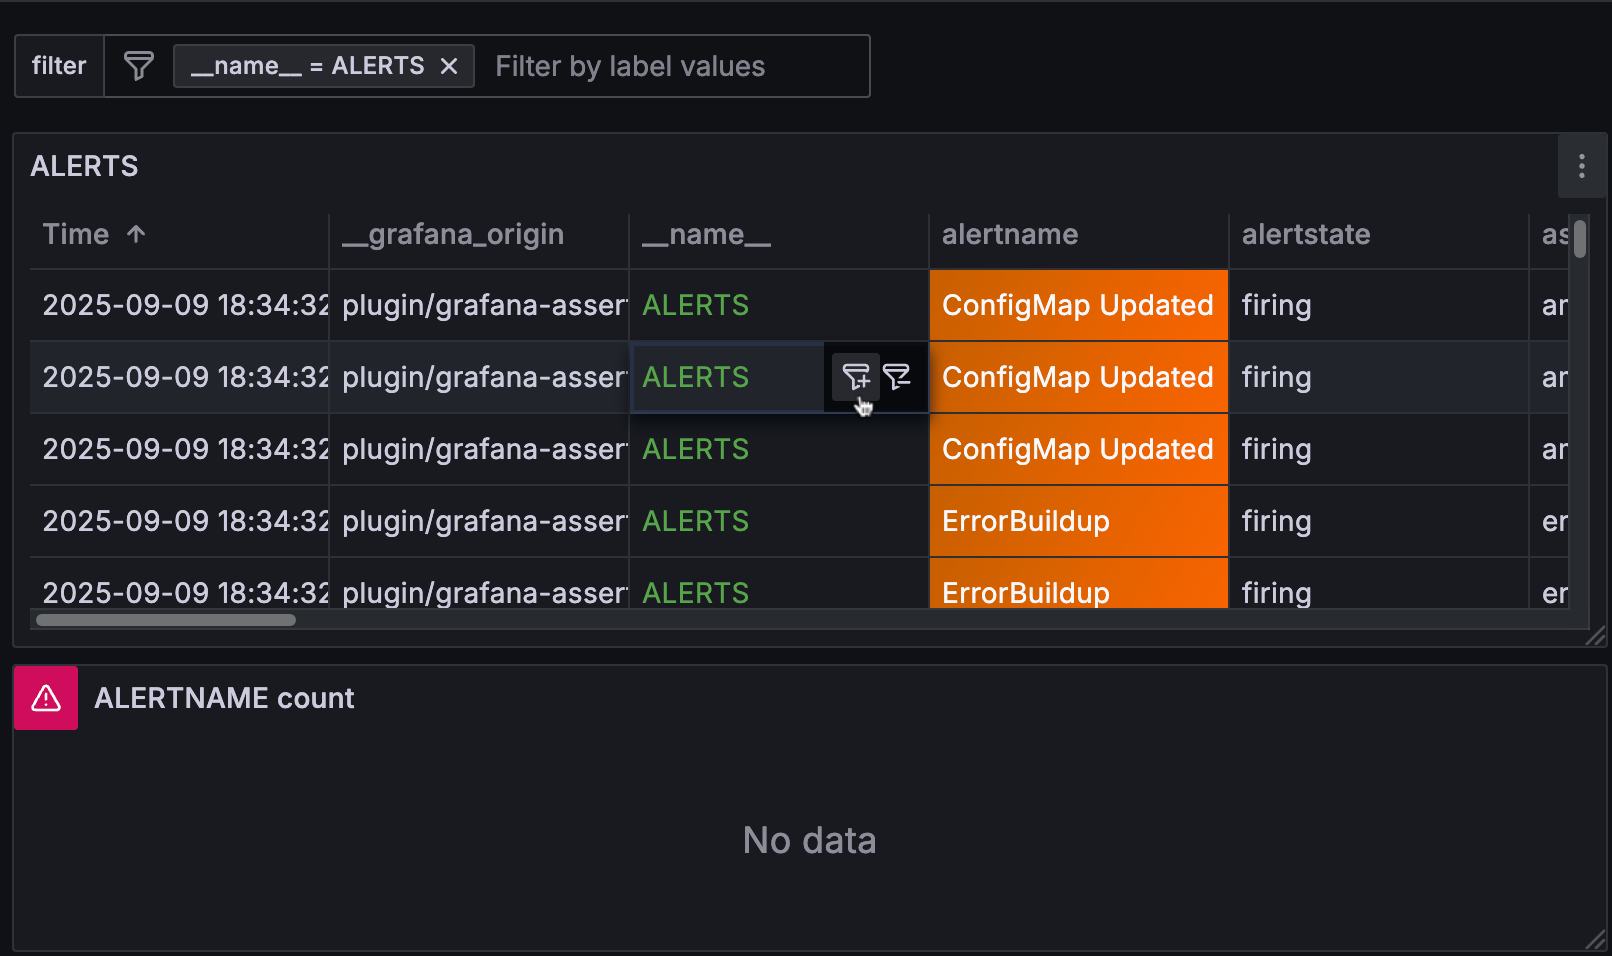
If one of the panels in the dashboard using that data source doesn’t include that variable value, the panel won’t return any data. In this example, the variable pair _name_ = ALERTS has been added to the filter so the bar chart doesn’t return any results:
In cases where the data source you’re using doesn’t support filtering, consider using the special Dashboard data source. For more information, refer to Filter any data using the Dashboard data source.
Panel-to-panel filtering
You can use data links to link back to the dashboard you are currently on. This enables “panel-to-panel filtering,” where clicking a data point in one panel updates the dashboard variables and filters the rest of the dashboard.
To preserve the context of the current dashboard:
- Time range: You must explicitly include the current time range in the link.
- Variables: You must enable Include all variables to preserve existing selections.
- Ordering: Ensure that Include all variables is placed before the specific variable you are defining in the link.
Filters on the current dashboard are automatically preserved.
Learn more in:


