Use k6 Script Authoring mode
k6 Script Authoring is an AI-powered mode of the Grafana Assistant that helps you create production-ready k6 performance test scripts. Instead of writing code from scratch, you describe what you want to test and k6 Script Authoring mode returns a complete script that follows k6 best practices, including proper URL grouping, checks, thresholds, and built-in tracing and profiling instrumentation.
Before you begin
k6 Script Authoring mode requires Grafana Assistant to be enabled in your Grafana Cloud instance. Contact your administrator if you do not see the Assistant icon in the sidebar.
Access k6 Script Authoring mode
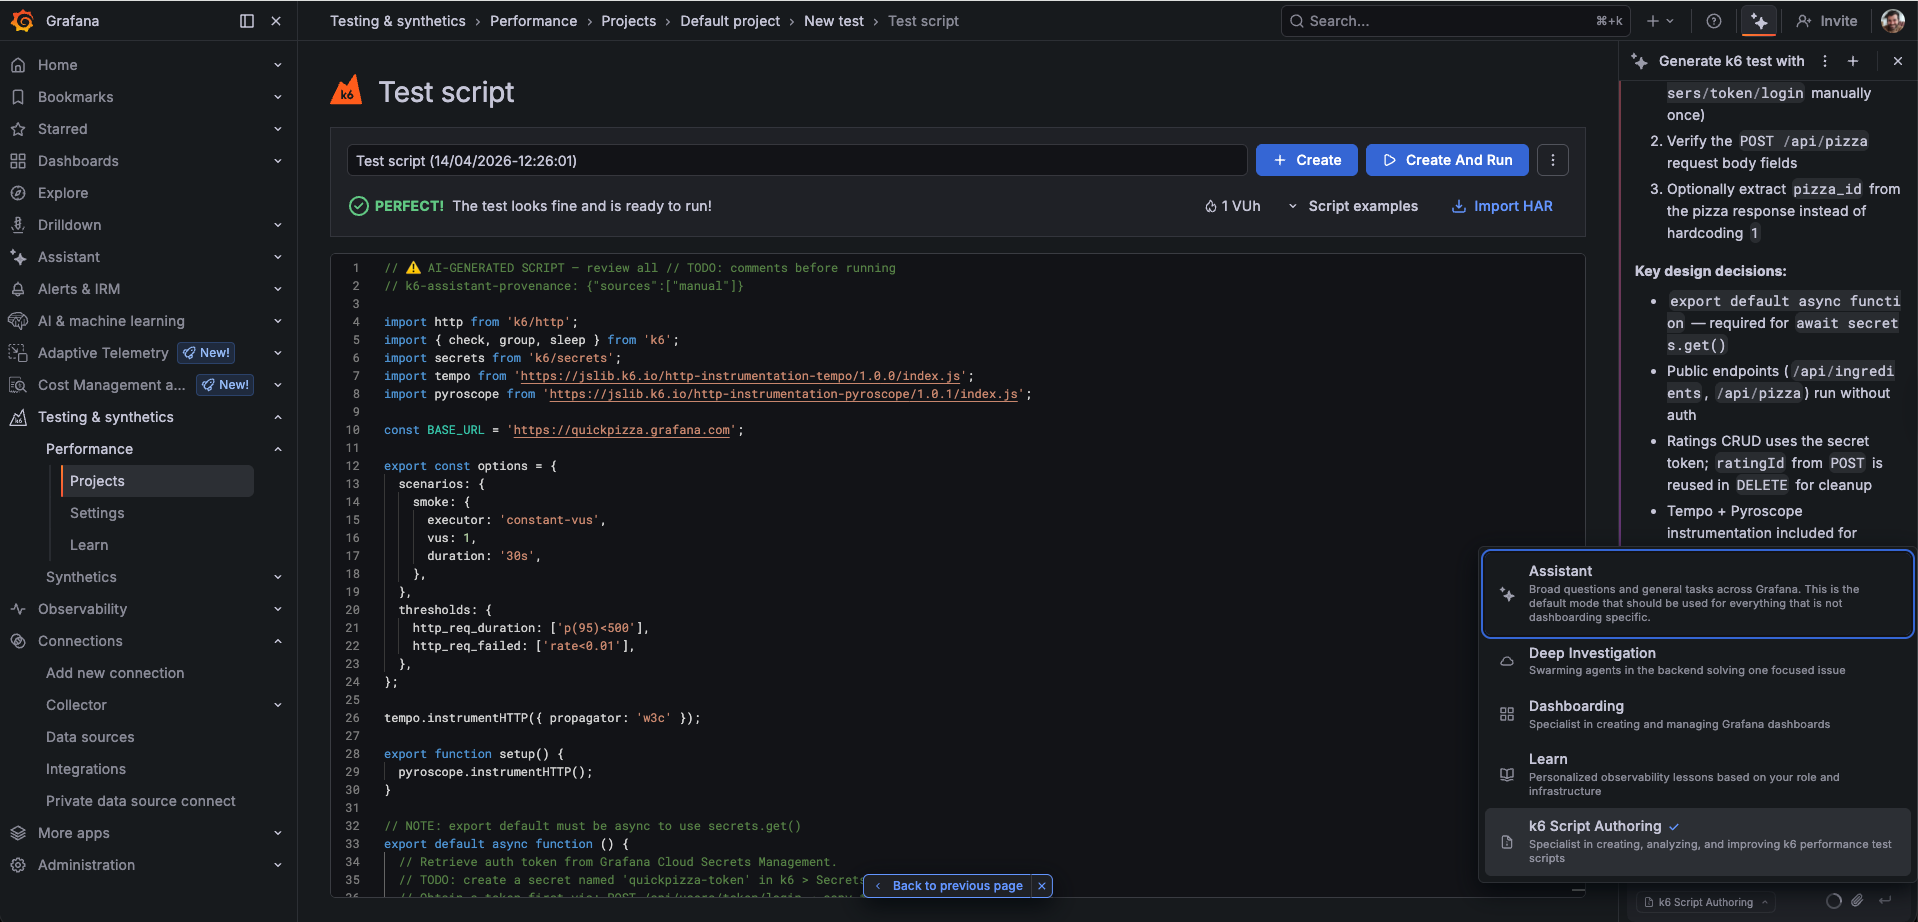
Follow these steps to open the Grafana Assistant in k6 Script Authoring mode.
- On the main menu, click Testing & synthetics > Performance.
- Click the Assistant icon at the top of the sidebar to open the Grafana Assistant.
- In the mode selector at the bottom of the Assistant panel, choose k6 Script Authoring.
After the mode loads, you see three workflows:
- Write a new test: Describe the service or endpoints you want to test; the mode returns a script.
- Discover and generate: Provide a service name; the mode queries your metrics, logs, and traces to find real endpoints and traffic patterns.
- Work with an existing script: Paste, attach, or open a script you already have; the mode analyzes, improves, or converts it.
If your first message is already a clear request, the workflow menu is skipped and generation begins immediately.
Write a new test
You describe the load scenario in plain language; you receive a script you can review and run.
Try a prompt like this for a fictional API:
“Generate a load test for https://api.example.com. Test the GET /products and POST /orders endpoints with 20 virtual users for 5 minutes.”
The mode returns a complete k6 script based on your description, including:
- HTTP requests to the specified endpoints
- Realistic load configuration (VUs, duration, stages)
- Response checks and thresholds
- URL grouping to prevent metric cardinality issues
- Tempo tracing and Pyroscope profiling instrumentation
You can also provide additional context to improve the generated script:
- Authentication details: Describe the auth scheme (bearer token, API key, basic auth) so the generated script includes the correct headers and setup code.
- OpenAPI/Swagger spec: Paste the spec, attach it as a file, or provide a URL. The spec is used to fill in accurate request bodies, parameters, and response checks, reducing the number of placeholder
// TODO:comments.
Open the k6 script editor
After you receive a script, you can open the script editor in Grafana Cloud k6 with a prompt such as “Open the k6 script editor.” You’re prompted to select which k6 project should contain the new test. After the editor opens, use Create to save the script or Create and Run to save and start a run. Refer to Use the script editor for editor features and options.
Discover and generate
Use this workflow when you want to discover real endpoints and traffic patterns from your Grafana observability data, or from your source code repository. This produces a more accurate script because the load profile is based on what your service actually handles in production.
Provide a service name
Start by entering a prompt with the name of the service you want to test:
“Generate a k6 script for the checkout service”
The mode queries your telemetry to generate the script.
Review and confirm endpoints
After discovery, you see endpoints listed by category, for example read operations, write operations, or internal and health probes. Each line usually includes RPS and p95 latency:
I found 9 endpoints for service "checkout":

Read operations
1. GET /api/v1/products/:id      210 RPS · p95 55ms
2. GET /api/v1/cart/:cartId       45 RPS · p95 120ms
3. GET /api/v1/orders/:orderId    12 RPS · p95 95ms

Write operations
4. POST /api/v1/orders             8 RPS · p95 380ms
5. PUT  /api/v1/cart/:cartId       6 RPS · p95 210ms
6. DELETE /api/v1/cart/items/:id   2 RPS · p95 180ms

Internal / health
7. GET /health                   520 RPS · p95 2ms
8. GET /metrics                   80 RPS · p95 5ms
9. GET /internal/cache/stats       1 RPS · p95 8ms

My suggested selection: 1, 2, 4, 5 (covers ~90% of observed traffic, read + write mix)
- Skipping health probes (#7, #8) — they inflate RPS and are not meaningful to stress-test
- Skipping #9 — internal endpoint, < 1 RPS

Does this look good, or would you like to add or remove any endpoints?
You can reply with endpoint numbers, plain language (for example, “only write operations” or “add the delete endpoint”), or just confirm the suggestion.
Enrich with an OpenAPI spec
After you confirm the endpoint selection, you can supply an OpenAPI or Swagger spec for the service when you have one. That input is used to fill in:
- Path and query parameters
- Request body schemas
- Authentication schemes
- Expected response codes and fields for
check()assertions
You can provide the spec in any of these ways:
- File attachment: Use the attachment button in the chat input to attach a JSON or YAML spec file.
- Paste: Copy and paste the spec content directly into the chat.
- Public URL: Provide the URL so the spec can be fetched from a public location.
- Private or internal URL: Use your connected Infinity data source to fetch a spec from an internal network.
If you don’t have a spec, generation continues with the observability data alone and marks fields that need your review with // TODO: comments.
Add a GitHub repository as context
If you provide a GitHub repository URL, the mode uses the repository as its primary source of context instead of querying observability data first.
“Generate a k6 script for https://github.com/my-org/checkout-service"
Relevant files are retrieved from the repository, including route handlers, API client code, authentication middleware, request/response schemas, and existing tests, and used to drive script generation. This workflow suits services that are not in production or that don’t send telemetry to your Grafana Cloud stack yet.
Work with an existing script
Use this workflow to analyze, improve, or convert an existing k6 script.
Analyze a script
Paste a script into the chat or attach one, then prompt for analysis, tuning, or conversion from another format.
- High metric cardinality: Dynamic URLs used directly as metric labels can produce thousands of unique time series, which causes performance problems in Grafana Cloud. The mode flags these and rewrites them using
http.urltemplate literals ortags: { name }. - Missing checks: HTTP requests with no response validation mean test failures go undetected. The output can add
check()calls to validate status codes and key response fields. - Missing thresholds: Without thresholds, a test has no pass/fail criteria. The output can add
thresholdsto theoptionsblock based on the endpoints and response time data in your inputs. - Incorrect lifecycle usage: HTTP requests placed in the init context run once globally instead of per virtual user. The mode moves them to the correct VU code function.
- Invalid test options: Certain option combinations that are valid in k6 OSS fail validation in Grafana Cloud k6 (for example, mixing
durationwithiterations, or settingstartVUs: 0). The analysis may identify these and suggest corrections.
Improve a script
After analysis, enter a prompt to apply the fixes:
“Fix the issues you found and improve the load profile based on our production traffic”
The mode returns a rewritten script with the corrections applied and an explanation of what changed.
Convert a script
You can convert existing test artifacts into k6 scripts:
- Postman collection: Paste or attach your Postman collection JSON; conversion produces k6 code for requests, environment variables, pre-request scripts, and tests.
- curl commands: Paste one or more curl commands; conversion produces the corresponding k6 HTTP calls, including headers, authentication, and request bodies.


