Custom labels
Synthetic Monitoring allows you to define custom labels in your check definitions.
Query custom labels
Synthetic Monitoring uses the sm_check_info metric, which is an info metric, to present information about executed checks. Custom labels are applied to this metric.
All custom labels have a label_ prefix to ensure they don’t conflict with system-defined labels.
For example, if you create a custom label env with value prod, you can query the metric sm_check_info{label_env="prod"} to see the details for any checks with that custom label.
Query check metrics with custom labels
To apply custom labels to other metrics, you must use a Prometheus join. In short, PromQL supports the ability to join two metrics together: you can append a label set from one metric and to another at query time. That can be useful in Prometheus rule evaluations since it lets you generate a new metric for a series by appending labels from another info metric.
There are many resources where you can learn more about Prometheus joins:
- Many-to-one and one-to-many vector matches
- Left joins in PromQL
- How to join Prometheus metrics by label with PromQL
The following section provides a Synthetic Monitoring example.
Example
This example shows how to create an alert rule that triggers if the duration of a probe exceeds 250 ms for production environments.
This example uses the probe_duration_seconds metric for demonstration, but the information here applies to all the metrics produced by Synthetic Monitoring.
probe_duration_seconds, like all Synthetic Monitoring metrics, has four labels:
config_versioninstancejobprobe
Some metrics have additional labels, but all of them include these four.
To differentiate between development environments, this example uses a custom label called environment with the value prod.
Define a new HTTP check
Start by defining a new HTTP check with https://www.grafana.com/ as the target and example as the job name, and select a few locations. You can change the target and job to something more relevant to you. For the rest of this example, https://www.grafana.com/ is the instance and example is the job.
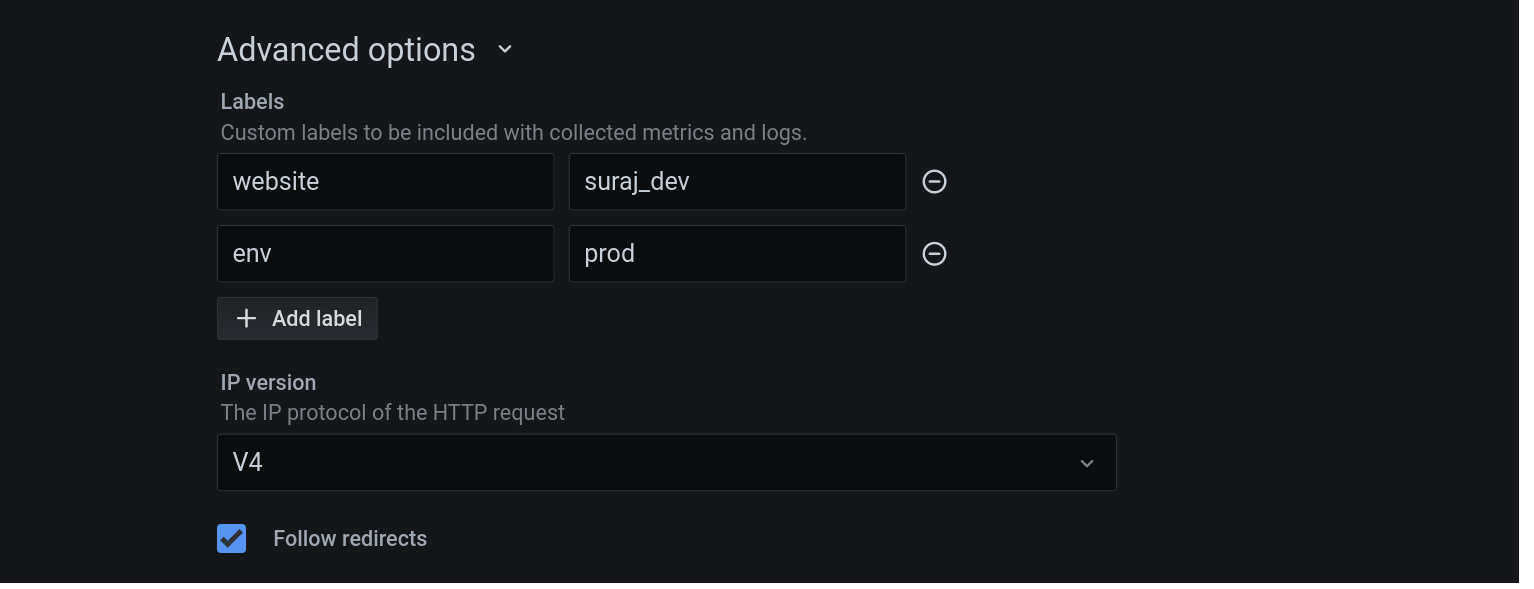
In the Advanced options section, add one custom label. For this example, the name is environment and the value is prod.
Note
Alternatively, you can also use an existing check. Just note the values of instance and job and make sure it has at least one custom label defined.
Let the check execute for a couple of minutes so that Grafana Cloud can collect some metrics.
Use Explore to examine the probe_duration_seconds metric
In your Grafana Cloud account, go to the Explore tab and enter the following expression:
probe_duration_seconds{job="example", instance="https://www.grafana.com/"}The expression returns the metrics for that job/instance pair, one for each location you have selected.
Notice that the custom label isn’t included in the result.
Join with sm_check_info to retrieve the custom labels
The custom labels are applied to sm_check_info. That means you need to join your metric of interest with this one.
Change the previous expression to look like this:
probe_duration_seconds{job="example", instance="https://www.grafana.com/"}
*
on (job, instance, probe, config_version)
sm_check_info{job="example", instance="https://www.grafana.com/"}
That produces the exact same result as before.
Note
Unpacking the new expression:
on (job, instance, probe, config_version)is saying “use these labels to join the values”.- The
sm_check_infometric always has the value 1.- Since the operation is
*, this produces the same values.You can find more information about this topic in the binary operator and vector matching keyword sections of the Prometheus documentation.
Propagate custom labels from the sm_check_info metric to the final result
Update the query like this:
probe_duration_seconds{job="example", instance="https://www.grafana.com/"}
*
on (job, instance, probe, config_version)
group_right ()
sm_check_info{job="example", instance="https://www.grafana.com/"}
Now you have the custom labels in the result and some other labels you might not want, such as config_version.
Note
PromQL allows you to perform many-to-one and one-to-many joins using one of two keywords. The question you need to ask is, “Which side of the operator has many elements and which side has one element” (for each set of the joining labels).
- Many-to-one is done using the
group_leftmodifier.- One-to-many is done using the
group_rightmodifier.In this example, you have a one-to-one relation: the same labels exist on the left and the right sides, with additional labels on the right that have single values. That’s why this example uses
group_right.
Drop excess labels
To drop the excess labels, you can change the expression to:
sum without (config_version) (
  probe_duration_seconds{job="example", instance="https://www.grafana.com/"}
  *
  on (job, instance, probe, config_version)
  group_right ()
  sm_check_info{job="example", instance="https://www.grafana.com/"}
)
sum without (config_version) says “sum all the values, grouping them by their labels, ignoring config_version”.
Note
Why would you want to drop
config_version?Because the value of that label changes every time you modify the check (for example, when you add a location or modify the frequency). If you leave it there, any time you modify the check, you end up with two different series: one that ends before the modification and one that starts after the modification. To make the series continuous again, you drop
config_version.
Note that the result also includes frequency and geohash labels. They come from sm_check_info. frequency corresponds to the interval in milliseconds between each run of the check. If you ever change that, you will have a discontinuity in the result. geohash comes from the probe’s configuration and represents the geographic coordinates of the location where the probe runs. While this is unlikely to change, it might change. That’s why you might want to drop these labels as well using this expression:
sum without (config_version, frequency, geohash) (
  probe_duration_seconds{job="example", instance="https://www.grafana.com/"}
  *
  on (job, instance, probe, config_version)
  group_right ()
  sm_check_info{job="example", instance="https://www.grafana.com/"}
)
At this point, you have multiple time series, one per location where the check is running.
Besides the job, instance, and probe labels, the result has label_env with prod as its value.
Create the final expression that you can alert on
Add a threshold to the expression like this:
sum without (config_version, frequency, geohash) (
  probe_duration_seconds{job="example", instance="https://www.grafana.com/"}
  *
  on (job, instance, probe, config_version)
  group_right ()
  sm_check_info{job="example", instance="https://www.grafana.com/"}
)
> 0.250
If you use this expression in an alert rule, it will trigger if the duration of the probe exceeds 250 ms. You can use label_env for alert routing decisions.
Optionally filter based on custom labels
As explained before, custom labels are applied to the sm_check_info metric. If you want to filter based on them, apply the filter there.
Following the example, modify the query like this:
sum without (config_version, frequency, geohash) (
  probe_duration_seconds{job="example", instance="https://www.grafana.com/"}
  *
  on (job, instance, probe, config_version)
  group_right ()
  sm_check_info{job="example", instance="https://www.grafana.com/", label_env="prod"}
)
That doesn’t change the result because the query still specifies the job and instance labels. In other words, this limits the result to a single check.
This means you can drop some of the labels, depending on what you want to achieve. For example, if you have consistently applied env="prod" to all checks that are relevant to the production environment, you could use something like this:
sum without (config_version, frequency, geohash) (
  probe_duration_seconds{}
  *
  on (job, instance, probe, config_version)
  group_right ()
  sm_check_info{label_env="prod"}
)
> 0.250
That will produce a time series per location for every check that has that label defined on it. The alert will trigger if any check fails to meet the threshold.


