Create a custom Alloy configuration pipeline
With configuration pipelines, you can control collector behavior remotely and at scale. Configuration pipelines are made up of a unique name, a content body, and matching attributes.
This page explains how to build a custom Alloy configuration pipeline in the Grafana Fleet Management interface using the Alloy component editor. The editor provides a catalog of approximately 180 components across 12 categories, including Prometheus, Loki, OpenTelemetry, and others. Fill in a form to set up each component instead of writing Alloy syntax by hand.
You can also create pipelines from a template or write them yourself:
- Refer to the integration template setup guide to use a pre-built pipeline.
- Refer to the Alloy reference documentation to help you write a pipeline.
Before you begin
To create configuration pipelines in Fleet Management, you should:
- Have a Grafana Cloud account.
- Have administrator privileges or the ability to create and edit configuration pipelines. Refer to Roles and permissions in Fleet Management for more information.
- Update Grafana Alloy to the most current version. The Alloy component editor must be used with Alloy v1.15.1 or later.
- Understand the key terms and concepts of Fleet Management and how the service works.
Define the configuration pipeline
Build a pipeline by adding and linking Alloy components in the component editor.
In your Grafana Cloud stack, click Connections > Fleet Management and then switch to the Remote configuration tab.
Click Create configuration pipeline.
Click Custom configuration and then Next.
Enter a unique name for the pipeline.
Click Add Component to open the component catalog. A drawer opens with a searchable catalog of Alloy components grouped by category.
Type in the search field to find a component by name
Click the component you want to add. The drawer displays a form with the component’s required arguments, optional arguments, and fields for referencing other components.
Fill in the fields.
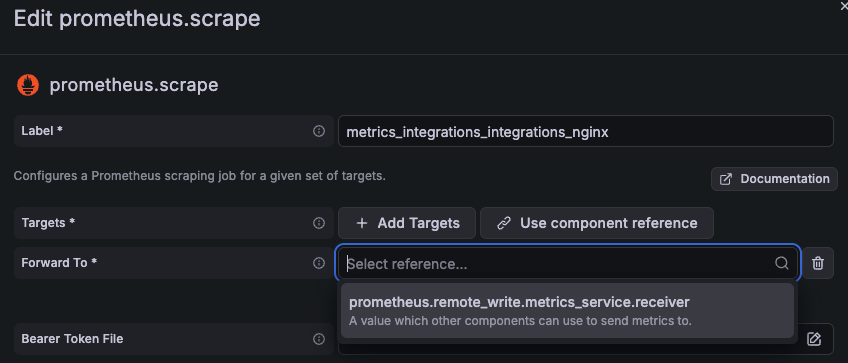
To reference another component, for example in the
forward_toorreceiverarguments, select the dropdown arrow in the reference box. The menu lists the compatible components already defined in the pipeline. If the component you want to reference isn’t in the list, add it to the pipeline first, then edit the referencing component.![A form in the Alloy component editor in the Fleet Management interface where a dropdown menu lists available components that can be referenced.]()
When the form is complete, click Save. The editor appends the new component block to the end of your configuration.
Continue adding components until the pipeline is complete. Each pipeline must be self contained and have the necessary components to send telemetry over the network to persistent storage.
Note
Components can be reused across pipelines with an advanced Fleet Management feature called pipeline export injection.
If you want to label the telemetry you collect, inject collector attributes into the pipeline.
Scroll down to click Test configuration pipeline to validate the configuration. The pipeline editor runs two checks and provides real-time feedback for:
- Syntax.
- Configuration validity. The editor validates against several Alloy versions to see if the pipeline will load successfully. When a warning is reported, the Alloy version where the issue was found is listed along with the error. Compare that version to the Alloy version of your matched collectors to decide whether the warning is something you need to fix now or a notice for a future upgrade.
The validation checks can pass with no issues, pass with warnings, or fail. Warnings don’t prevent you from creating the pipeline. Failures block you from saving the pipeline. If an issue is reported, you can make the fix yourself or click the Assistant button and select Fix errors in Assistant.
Note
If you don’t see the Grafana Assistant button or the button is disabled, Assistant has not been enabled on your stack. Contact your stack administrator for more details.
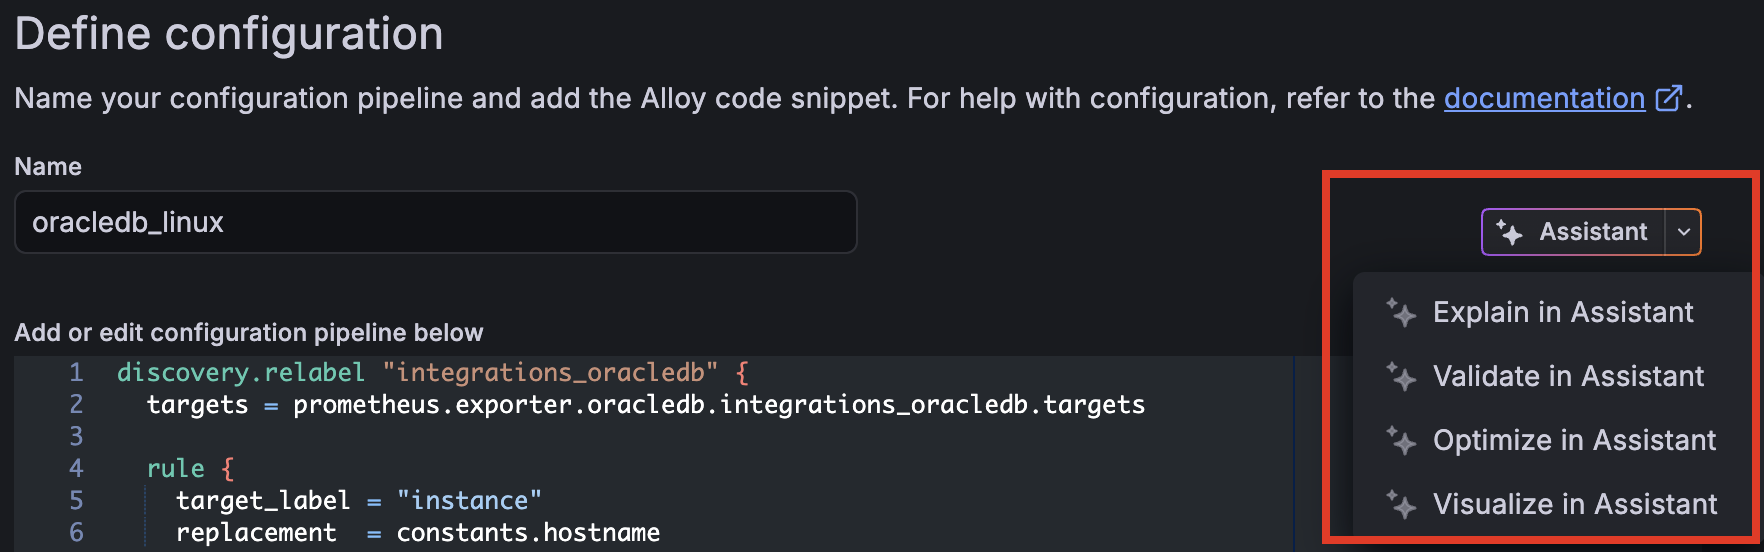
To understand how your pipeline works, the different components in use, and potential areas for optimization, click the Assistant button. You can choose to have Grafana Assistant explain the pipeline, validate the syntax or fix errors if there are any, optimize the configuration, or create a diagram of the pipeline.
![One section of the Define configuration page in the Fleet Management interface in Grafana Cloud where a menu shows the tasks that Grafana Assistant can perform on the selected configuration pipeline. The four options are Explain in Assistant, Validate in Assistant, Optimize in Assistant, and Visualize in Assistant.]()
Click Next to assign the configuration pipeline to collectors or click Save to save an incomplete pipeline.
Assign the configuration pipeline
Configuration pipelines are incomplete until you add matching attributes that assign them to collectors.
Note
If you saved an incomplete configuration, click the Edit icon from the Configuration pipeline list to return to the Define a configuration pipeline page.
Click Next on the Define a configuration pipeline page.
Use the dropdown menus to create a matching attribute. The Collector list updates in real time to show you which collectors have been assigned the configuration pipeline. Only active collectors are displayed in this list by default. Inactive collectors are not shown, but you can include them by updating the status filter.
Continue adding matching attributes as needed.
GetConfigpolling requests to the API can accept a maximum of 25 attributes.Click Save to activate the configuration pipeline and return to the Configuration pipeline list.
Activate or deactivate a configuration pipeline with a click of the Active switch.
To verify the pipeline details without re-entering the editor, click on the pipeline name. You see a details drawer containing pipeline metadata, configuration content, and matched collectors.
Assigning the matching attribute profiling_enabled=true.
Next steps
Now that you’ve started remotely configuring your fleet, learn how to streamline your workflows and track historical changes to your configuration pipelines.


