Monitoring a Linux host using Prometheus and node_exporter
This guide will show you how to install Prometheus and node_exporter to a Linux node and use them to push metrics to Grafana Cloud. Then it will show you how to install a preconfigured dashboard or create your own to visualize those metrics.
Prerequisites
A Grafana Cloud account, as shown in Quickstarts.
A Grafana Cloud Access Policy token with the
metrics:writescope (permission) to send metrics to your Grafana Cloud Prometheus instance.A Linux machine
Command line (terminal) access to that Linux machine
Account permissions sufficient to install
wgeton the Linux machine
Install and run node_exporter on the node
We are going to collect metrics from a Linux node using node_exporter. If you want to collect metrics from Windows, you can follow a similar process using windows_exporter.
Download the node_exporter compressed package.
wget https://github.com/prometheus/node_exporter/releases/download/v*/node_exporter-*.*-amd64.tar.gzExtract the node_exporter binary, which will collect metrics from the Linux machine, format those metrics in a Prometheus format, and provide those metrics on an internal port for Prometheus to scrape.
tar xvfz node_exporter-*.*-amd64.tar.gzChange to the directory created during extraction.
cd node_exporter-*.*-amd64Make the node_exporter binary executable.
chmod +x node_exporterRun the node_exporter binary.
./node_exporterTest that metrics are being exported on port 9100.
curl http://localhost:9100/metricsIf you see metrics on your screen, all is well. If not, check your steps for typos, make sure the binary is executable, and whether curl works with other URLs.
Install Prometheus on the node
Next, we will download and install Prometheus on the node to scrape the metrics being provided by node_exporter and send them to Grafana Cloud. Prometheus collects metrics and makes them available for searching and visualization. Typically, Prometheus pulls metrics from configured sources, but we will use the remote_write feature which will push metrics from Prometheus to Grafana Cloud.
Download the Prometheus compressed package.
wget https://github.com/prometheus/prometheus/releases/download/v*/prometheus-*.*-amd64.tar.gzExtract the binary.
tar xvf prometheus-*.*-amd64.tar.gzChange to the directory created during extraction.
cd prometheus-*.*Create a configuration file for Prometheus, so that it can scrape the metrics and to send them to Grafana Cloud. This configuration file has many options. For our example, it only needs three sections:
globalis the section into which configurations common across all Prometheus actions are placed. In this example, we set thescrape_intervalfor checking and grabbing metrics from configured jobs to happen every 15 seconds.scrape_configsis where we name our job; this name will be used in Grafana to help you find associated metrics. It is also where we configure Prometheus to find the metrics for that job.remote_writeis where we instruct Prometheus to send the scraped metrics to a secondary endpoint.
Edit this file to include your Grafana Cloud username and the Access Policy token you created earlier.
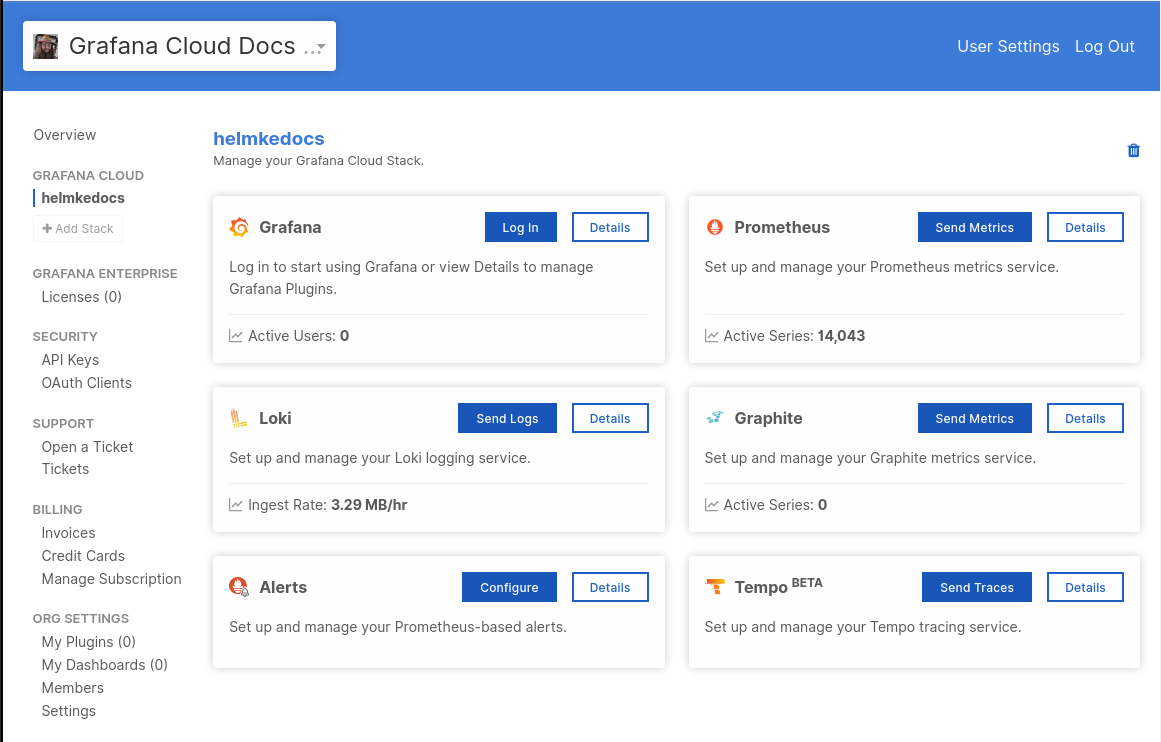
To confirm your username and URL, first navigate to the Cloud Portal, then from the Prometheus box, click Send Metrics.
Create a Prometheus configuration file named prometheus.yml in the same directory as the Prometheus binary with the following content.
global:
  scrape_interval: 60s

scrape_configs:
  - job_name: node
    static_configs:
      - targets: ['localhost:9100']

remote_write:
  - url: '<Your Metrics instance remote_write endpoint>'
    basic_auth:
      username: '<Your Grafana Username>'
      password: '<Your Grafana Cloud Access Policy Token>'
You can find the /api/prom/push URL, username, and password for your metrics endpoint by clicking on Details in the Prometheus card of the Cloud Portal.
Save the file.
Run the Prometheus binary, instructing Prometheus to use the configuration file we just created.
./prometheus --config.file=./prometheus.ymlIf you don’t want to have to start Prometheus directly from the command line every time you want it to run, you can create a systemd service for it.
Check that metrics are being ingested into Grafana Cloud
Within minutes, metrics should begin to be available in Grafana Cloud. To test this, use the Explore feature. Click Explore in the sidebar to start. This takes you to the Explore page, which looks like this.
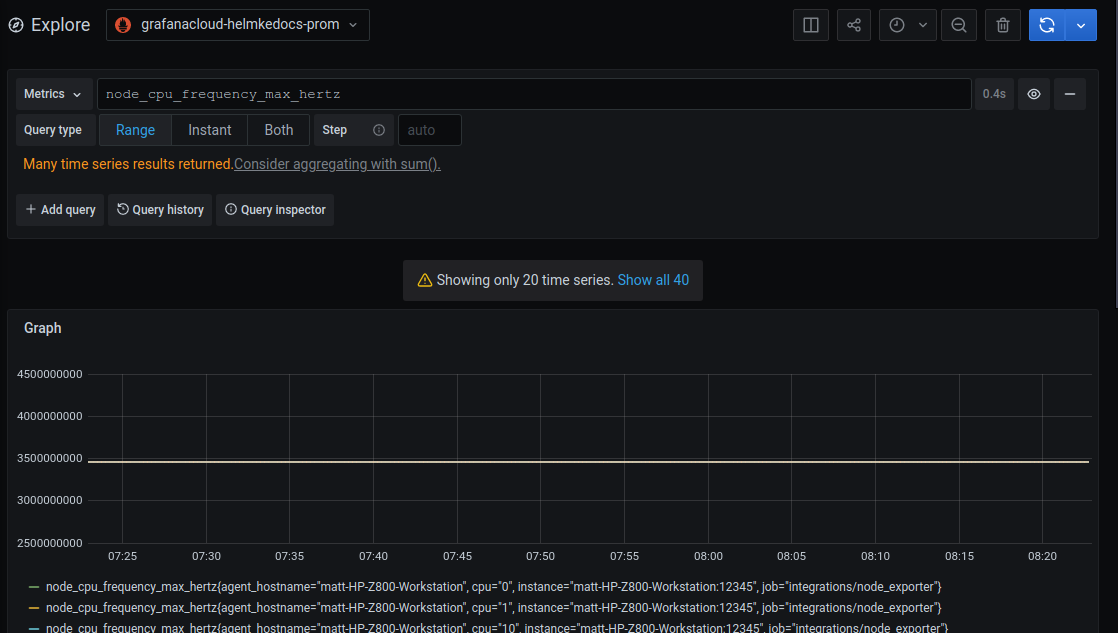
At the top of the page, use the dropdown menu to select your Prometheus data source.
Use the Metrics dropdown to find the entry for node, which is the job_name we created in prometheus.yml.
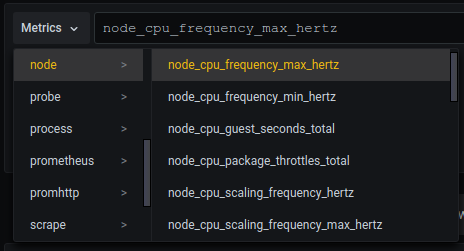
If node is not listed, metrics are not being collected. If metrics are listed, this confirms that metrics are being received.
If metrics are not displayed after several minutes, check your steps for typos, make sure the binary is executable, and whether Prometheus is running on the Linux machine.
Configure a dashboard
Here you have two options: install a pre-made dashboard or create a dashboard from scratch.
Import a dashboard
Official and community-built dashboards are listed on the Grafana website Dashboards page.
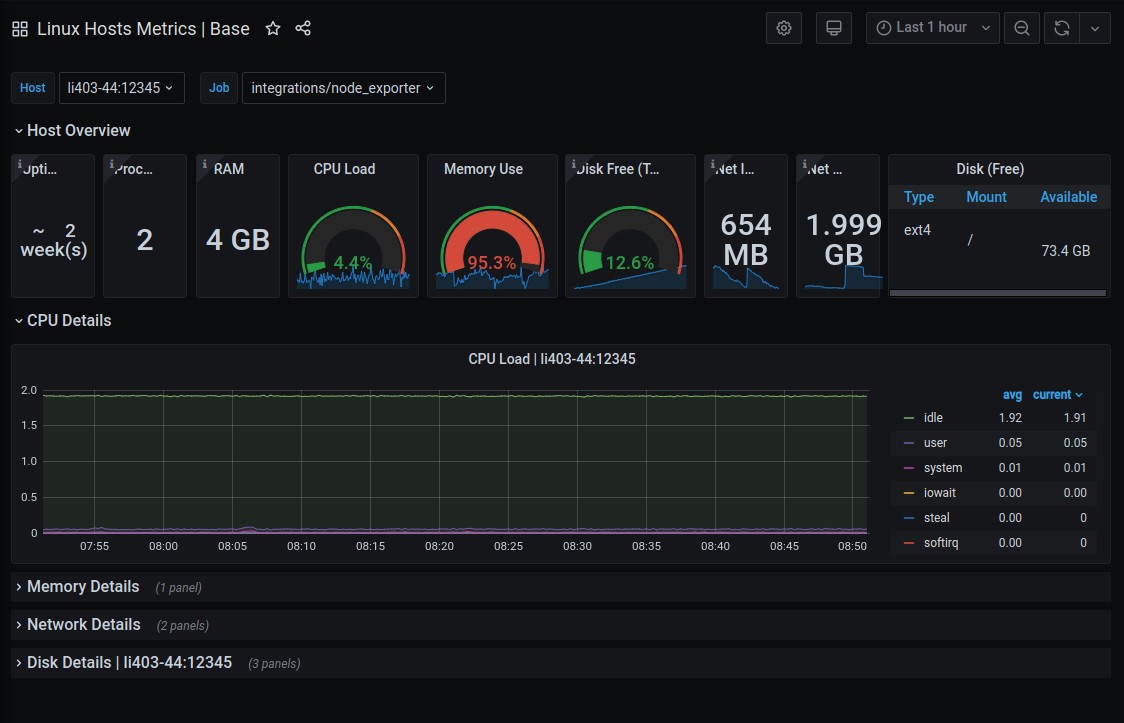
Dashboards on this page will include information in the Overview tab about special configurations you may need to use to get the dashboard to work. For our example, we require a dashboard that is built to display Linux Node metrics using Prometheus and node_exporter, so we chose Linux Hosts Metrics | Base. Note the ID of the dashboard: 10180. We will use this ID in the next step.
In Grafana, click Dashboards in the left-side menu to go to the Dashboards page.
Click New and select Import in the dropdown.
Enter the ID number of the dashboard we selected.
Click Load.
You’ll get a dashboard like this one.
See Export and import to learn more about importing Grafana dashboards.
Create a Dashboard
To create a dashboard, it is helpful to know PromQL and have a sense of the metrics and calculations based on those metrics that you want to display in your dashboard panels.
In Grafana, click Dashboards in the left-side menu to go to the Dashboards page.
Click New and select New Dashboard in the dropdown menu.
Your new dashboard starts out empty.
Click + Add visualization to open the Edit panel screen.
Complete instructions for creating a dashboard panel (indeed, multiple panels to create a dashboard) are beyond the scope of this quickstart. To learn more about creating a panel, see the Grafana Add a panel documentation.


