Grafana Agent health integration for Grafana Cloud
The Grafana agent integration lets you monitor metrics and logs of a Grafana agent instance
This integration includes 4 useful alerts and 5 pre-built dashboards to help monitor and visualize Grafana Agent health metrics and logs.
Dashboards
The Grafana Agent health integration installs the following dashboards in your Grafana Cloud instance to help monitor your system.
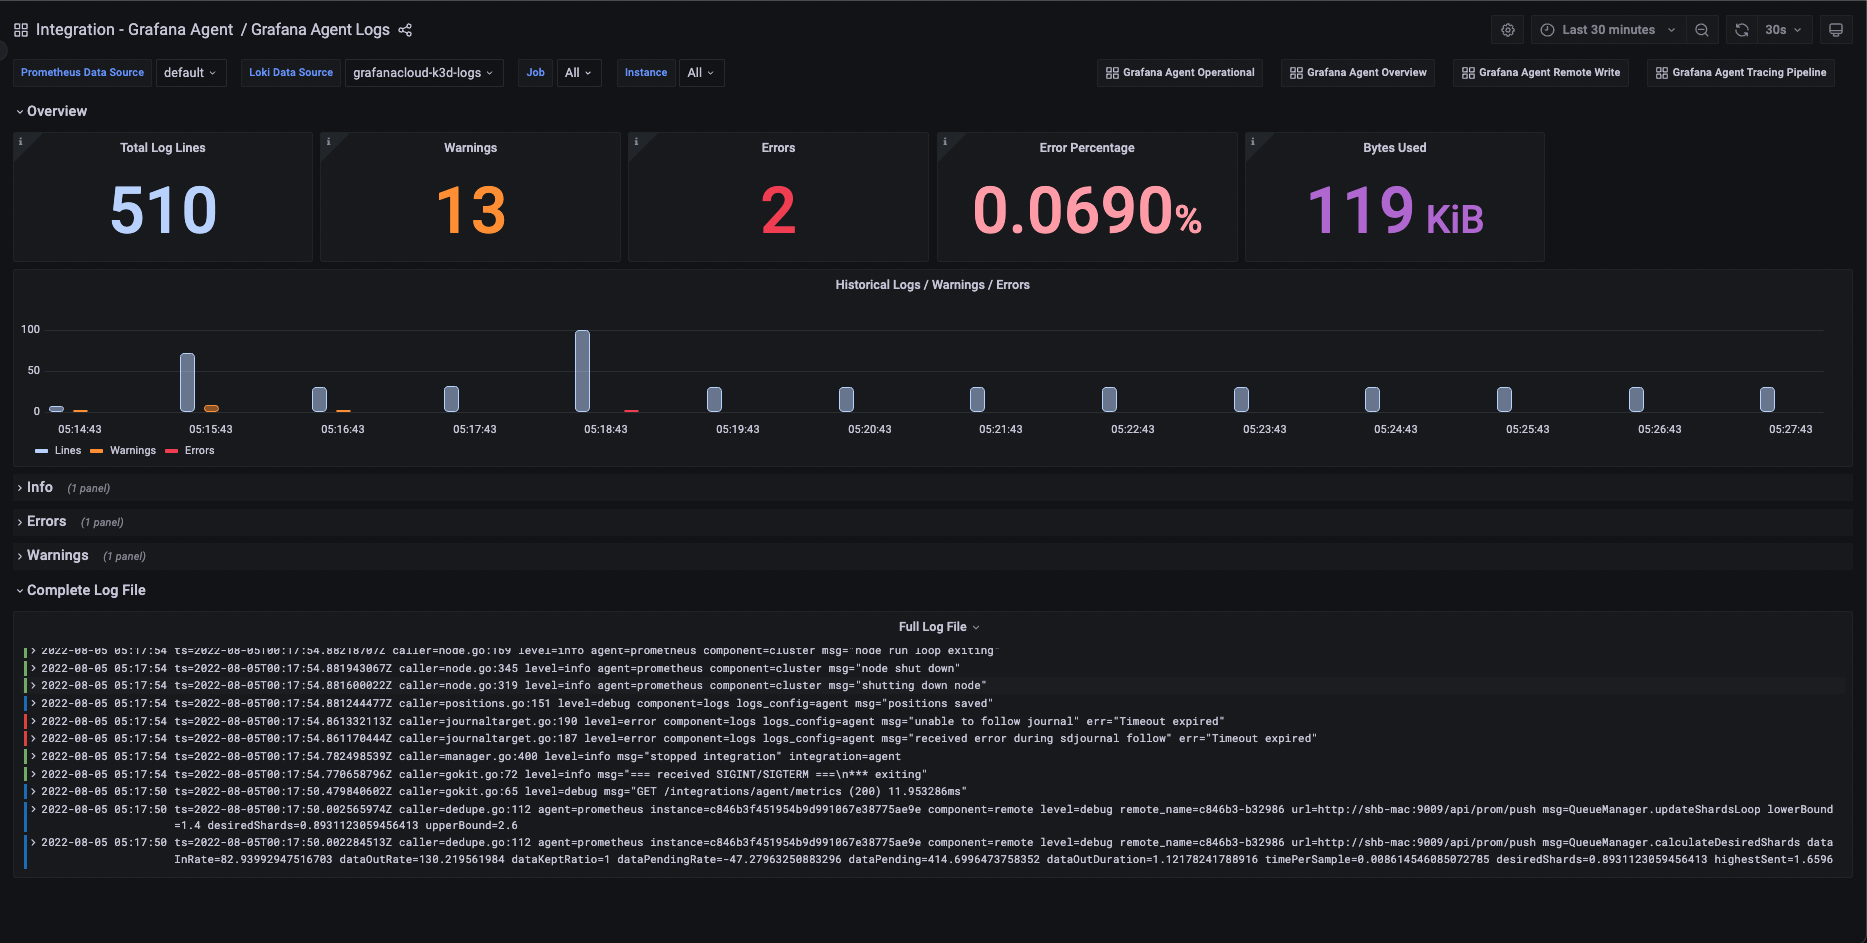
- Grafana Agent Logs
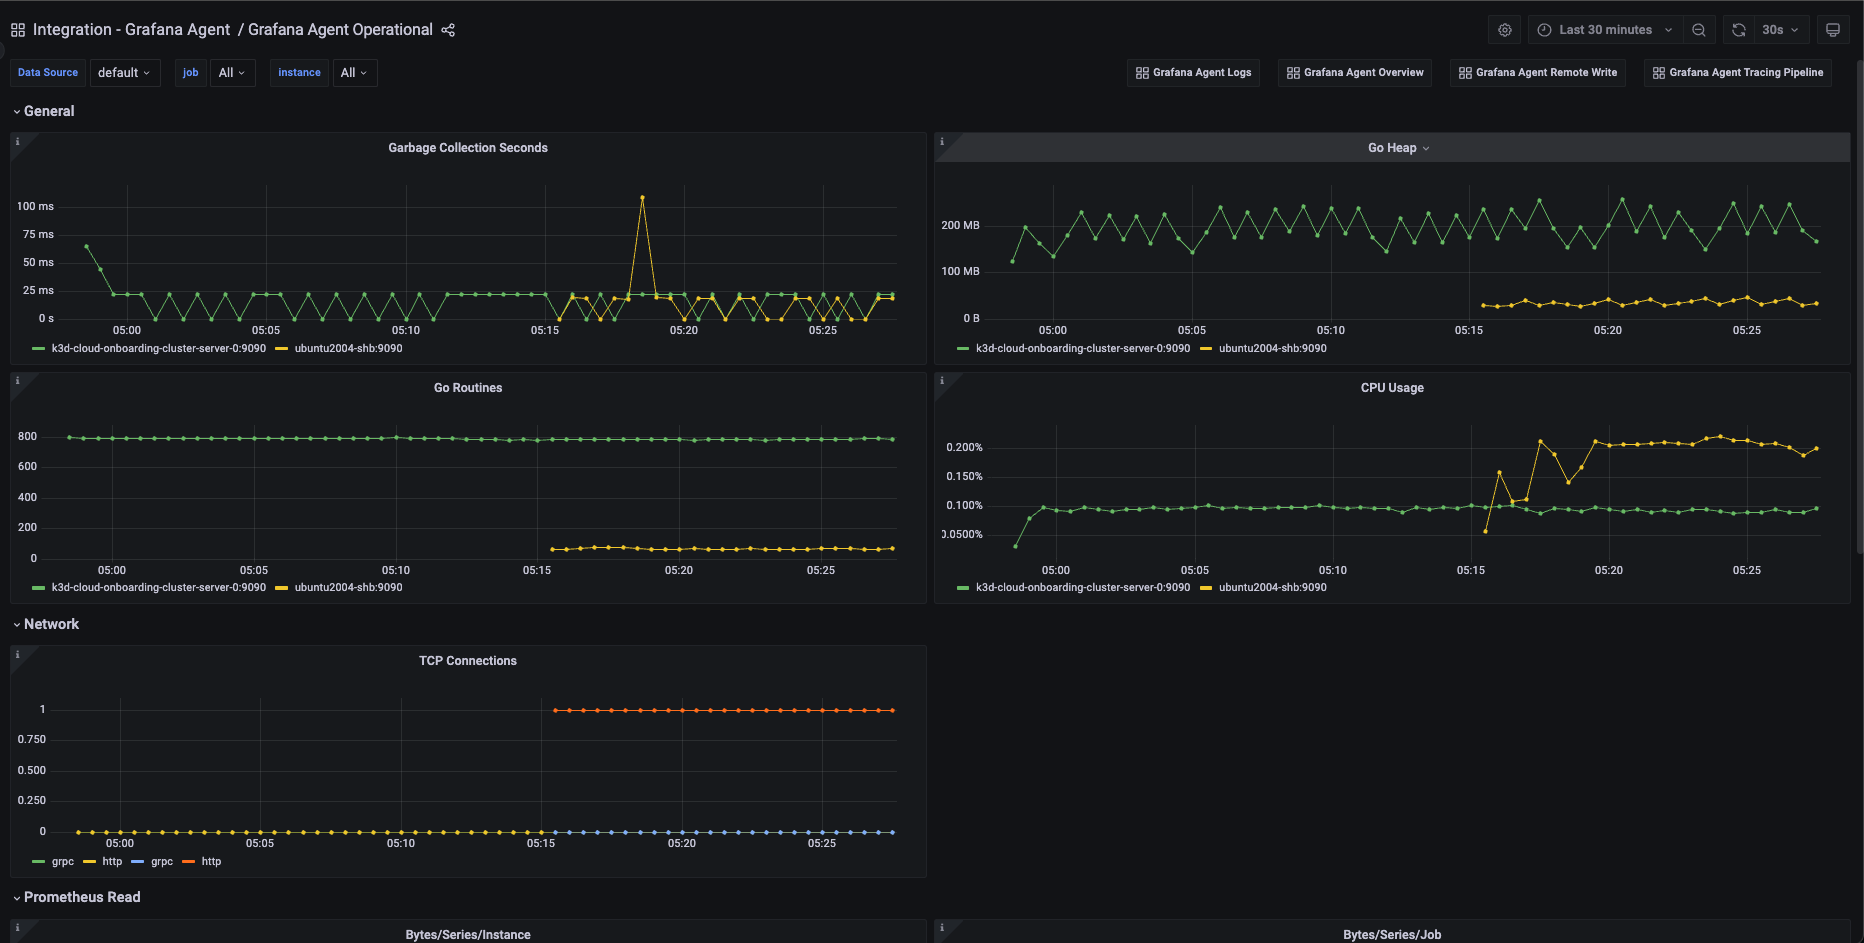
- Grafana Agent Operational
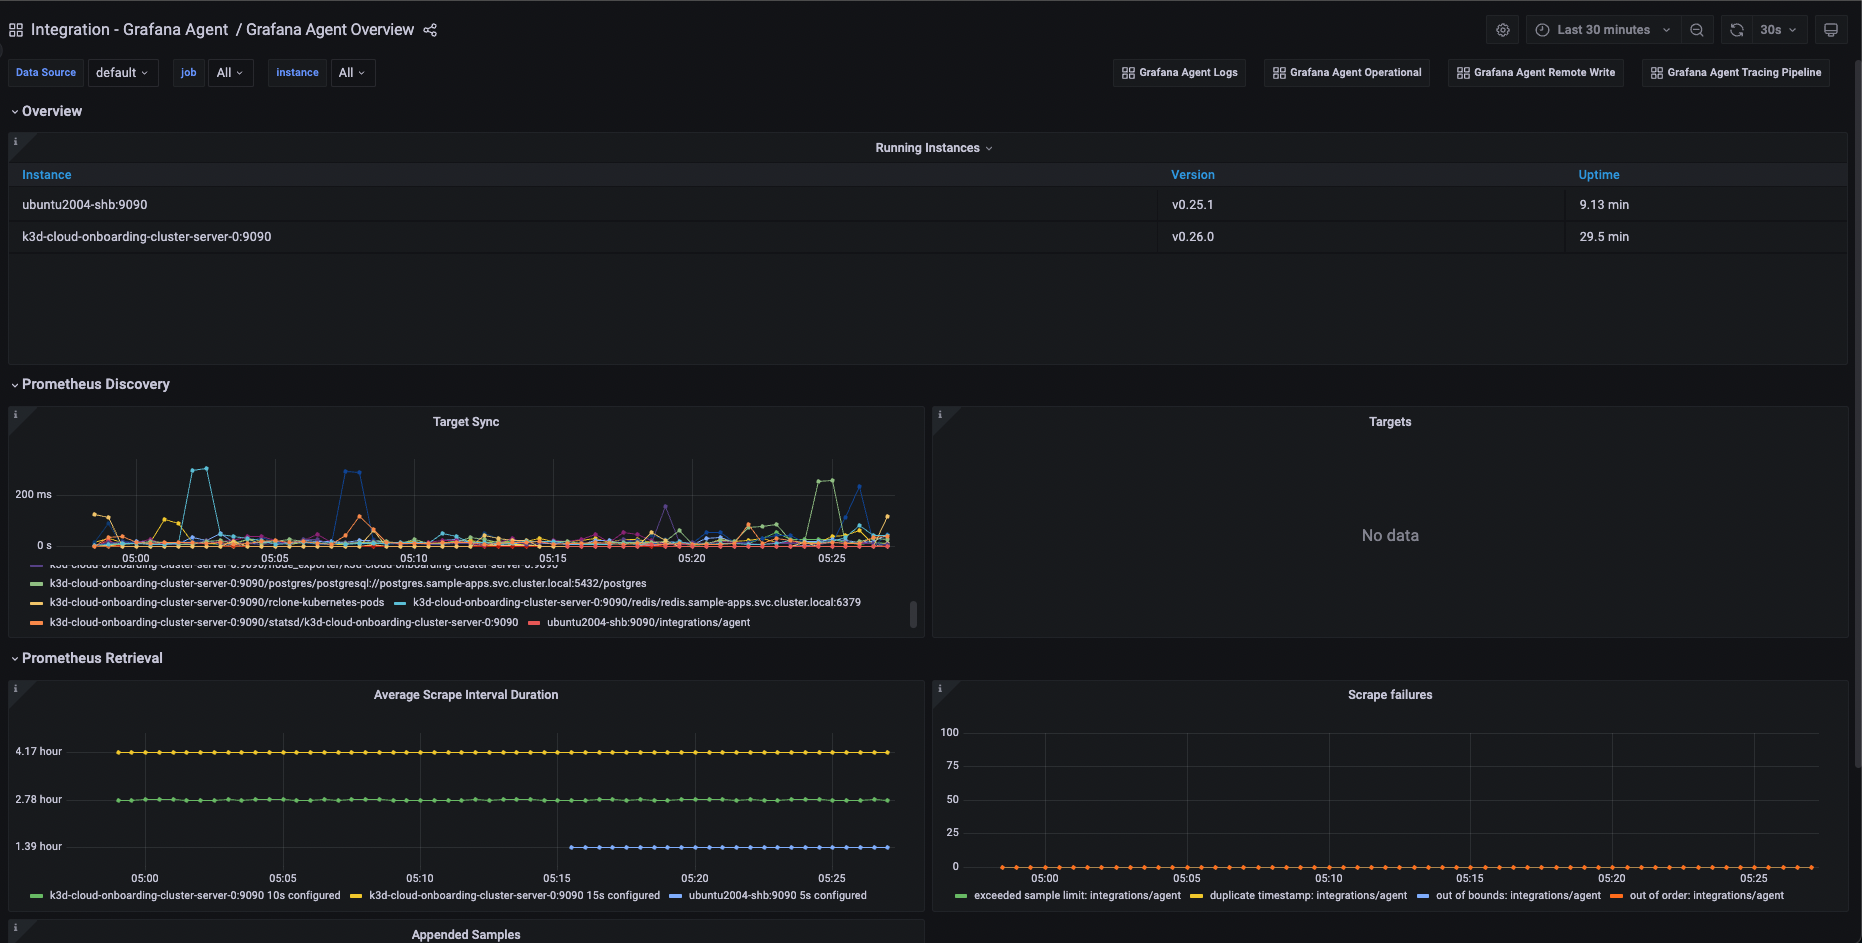
- Grafana Agent Overview
- Grafana Agent Remote Write
- Grafana Agent Tracing Pipeline
Grafana Agent Overview
Grafana Agent Logs
Grafana Agent Operational
Alerts
The Grafana Agent health integration includes the following useful alerts:
Metrics
The most important metrics provided by the Grafana Agent health integration, which are used on the pre-built dashboards and Prometheus alerts, are as follows:
- agent_build_info
- agent_tcp_connections
- agent_wal_samples_appended_total
- agent_wal_storage_active_series
- go_gc_duration_seconds_count
- go_goroutines
- go_memstats_heap_inuse_bytes
- process_cpu_seconds_total
- process_start_time_seconds
- prometheus_remote_storage_enqueue_retries_total
- prometheus_remote_storage_highest_timestamp_in_seconds
- prometheus_remote_storage_queue_highest_sent_timestamp_seconds
- prometheus_remote_storage_samples_dropped_total
- prometheus_remote_storage_samples_failed_total
- prometheus_remote_storage_samples_pending
- prometheus_remote_storage_samples_retried_total
- prometheus_remote_storage_samples_total
- prometheus_remote_storage_sent_batch_duration_seconds_bucket
- prometheus_remote_storage_sent_batch_duration_seconds_count
- prometheus_remote_storage_sent_batch_duration_seconds_sum
- prometheus_remote_storage_shard_capacity
- prometheus_remote_storage_shards
- prometheus_remote_storage_shards_desired
- prometheus_remote_storage_shards_max
- prometheus_remote_storage_shards_min
- prometheus_remote_storage_succeeded_samples_total
- prometheus_sd_discovered_targets
- prometheus_target_interval_length_seconds_count
- prometheus_target_interval_length_seconds_sum
- prometheus_target_scrapes_exceeded_sample_limit_total
- prometheus_target_scrapes_sample_duplicate_timestamp_total
- prometheus_target_scrapes_sample_out_of_bounds_total
- prometheus_target_scrapes_sample_out_of_order_total
- prometheus_target_sync_length_seconds_sum
- prometheus_wal_watcher_current_segment
- traces_exporter_send_failed_spans_total
- traces_exporter_sent_spans_total
- traces_receiver_accepted_spans_total
- traces_receiver_refused_spans_total
- up
Changelog
# 1.0.1 - April 2024

* Update to latest mixin, fixes in Tracing pipeline dashboard

# 1.0.0 - March 2024

* Update to latest mixin, replacing Angular panels with React-based panels

# 0.0.6 - September 2023

* New Filter Metrics option for configuring the Grafana Agent, which saves on metrics cost by dropping any metric not used by this integration. Beware that anything custom built using metrics that are not on the snippet will stop working.

# 0.0.5 - August 2023

* Add instance label detection for logs on Linux

# 0.0.4 - August 2023

* Add regex filter for logs datasource

# 0.0.3 - August 2023

* Updates agent configuration:
    * Set bookmark path to default agent installation directory for windows
    * Separate bookmark filename from system and application event logs bookmark file

# 0.0.2 - June 2023

* Update mixin to include alerts

# 0.0.1 - July 2022

* Initial release
Cost
By connecting your Grafana Agent health instance to Grafana Cloud, you might incur charges. To view information on the number of active series that your Grafana Cloud account uses for metrics included in each Cloud tier, see Active series and dpm usage and Cloud tier pricing.


