OpenTelemetry Collector integration for Grafana Cloud
The OpenTelemetry Collector integration offers prebuilt dashboards and alerts based on the OpenTelemetry Collector internal telemetry.
This integration includes 4 useful alerts and 1 pre-built dashboard to help monitor and visualize OpenTelemetry Collector metrics, traces.
Dashboards
The OpenTelemetry Collector integration installs the following dashboards in your Grafana Cloud instance to help monitor your system.
- Collector overview
Collector overview
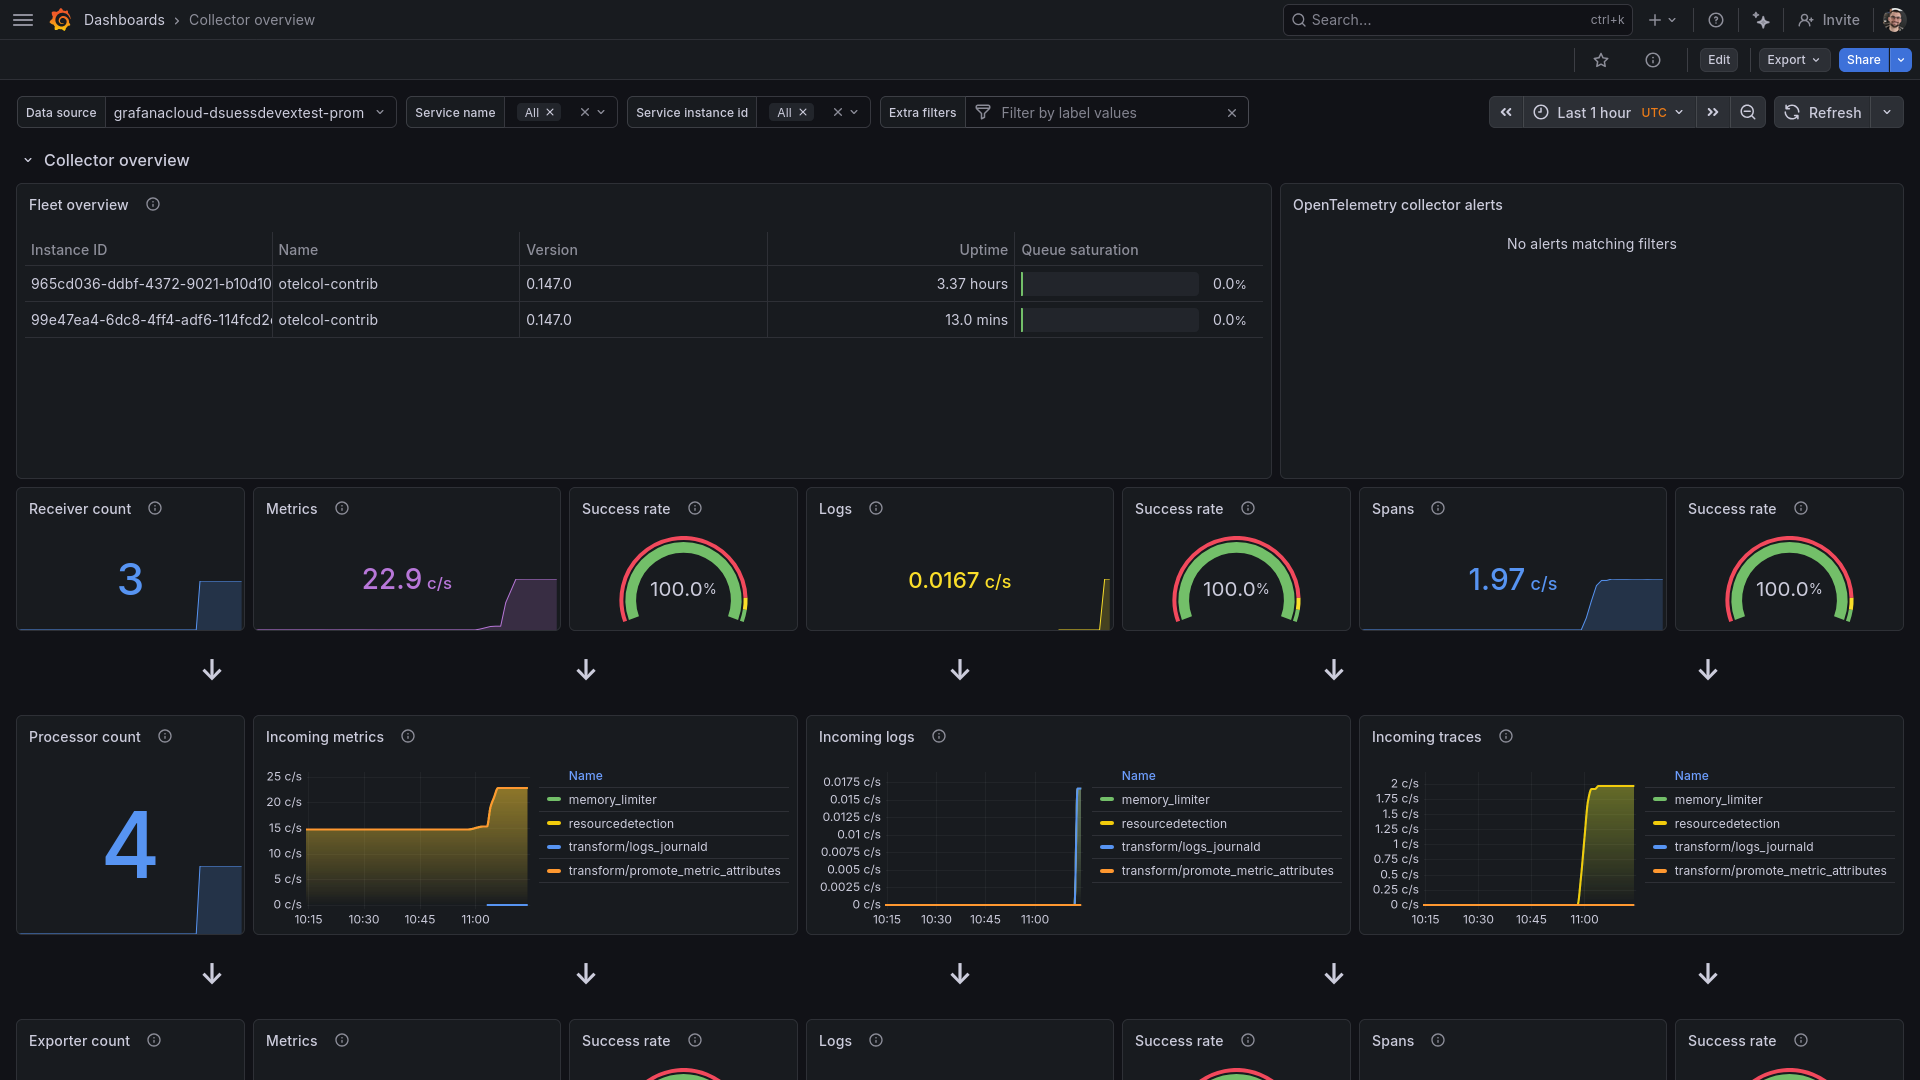
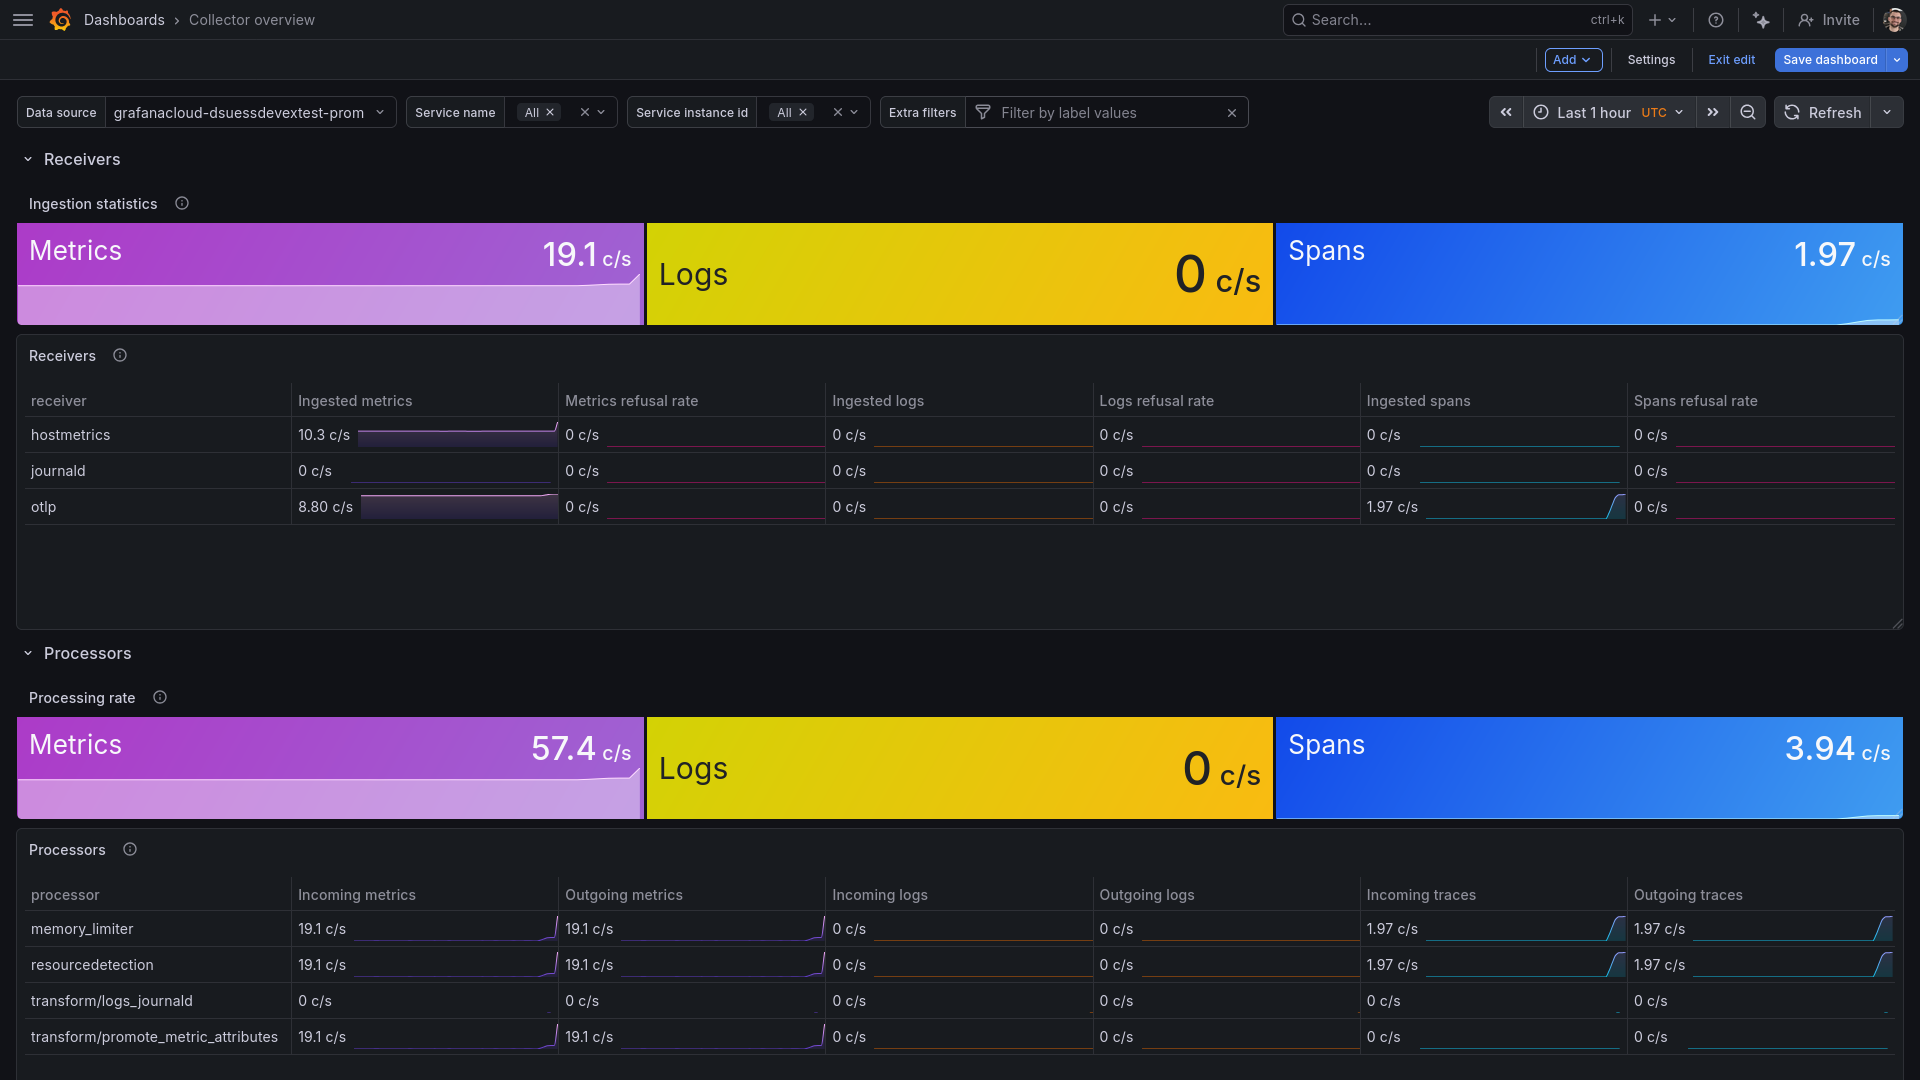
Receiver and processor statistics
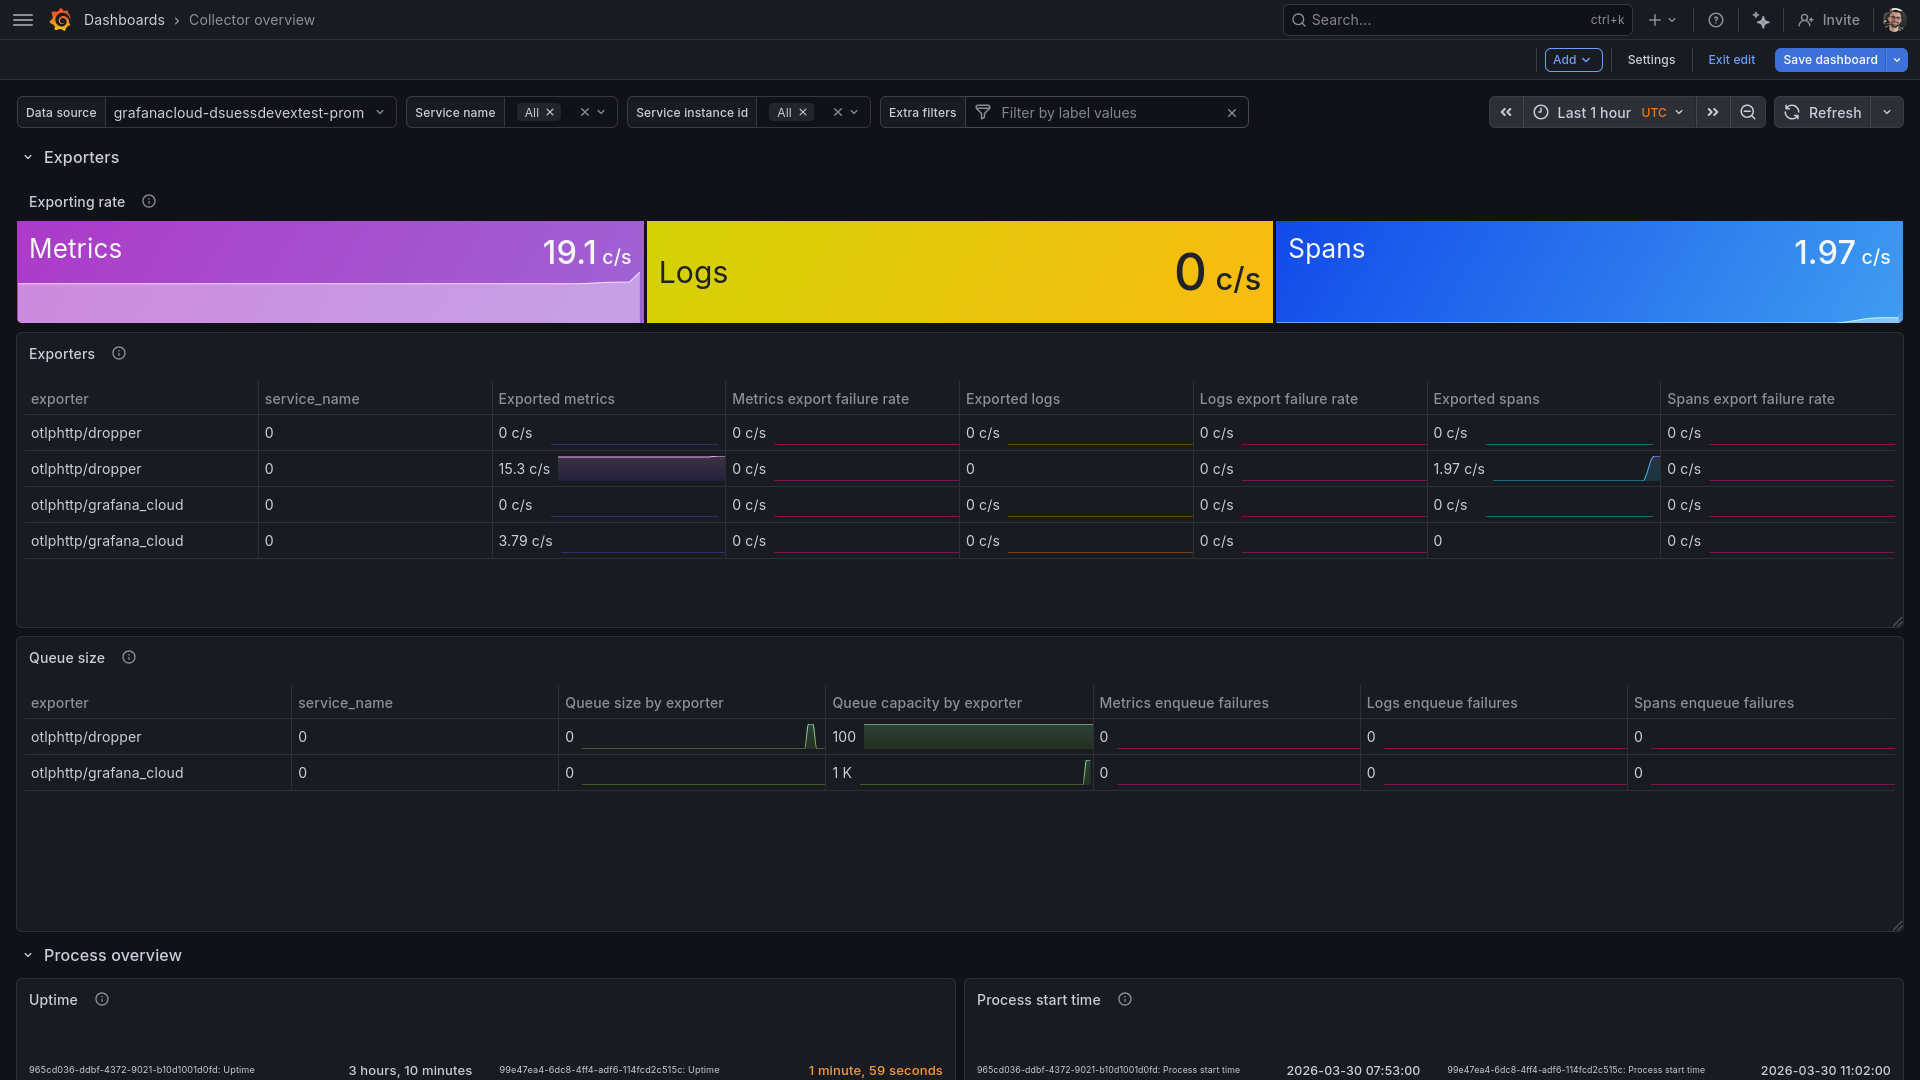
Exporter statistics and process uptime
Alerts
The OpenTelemetry Collector integration includes the following useful alerts:
Metrics
The most important metrics provided by the OpenTelemetry Collector integration, which are used on the pre-built dashboard and Prometheus alerts, are as follows:
- otelcol_exporter_enqueue_failed_log_records_total
- otelcol_exporter_enqueue_failed_metric_points_total
- otelcol_exporter_enqueue_failed_spans_total
- otelcol_exporter_queue_capacity
- otelcol_exporter_queue_size
- otelcol_exporter_send_failed_log_records_total
- otelcol_exporter_send_failed_metric_points_total
- otelcol_exporter_send_failed_spans_total
- otelcol_exporter_sent_log_records_total
- otelcol_exporter_sent_metric_points_total
- otelcol_exporter_sent_spans_total
- otelcol_process_cpu_seconds_total
- otelcol_process_memory_rss_bytes
- otelcol_process_uptime_seconds_total
- otelcol_processor_incoming_items_total
- otelcol_processor_outgoing_items_total
- otelcol_receiver_accepted_log_records_total
- otelcol_receiver_accepted_metric_points_total
- otelcol_receiver_accepted_spans_total
- otelcol_receiver_refused_log_records_total
- otelcol_receiver_refused_metric_points_total
- otelcol_receiver_refused_spans_total
- up
Changelog
# 1.0.0 - March 2026

* Initial release
Cost
By connecting your OpenTelemetry Collector instance to Grafana Cloud, you might incur charges. To view information on the number of active series that your Grafana Cloud account uses for metrics included in each Cloud tier, see Active series and dpm usage and Cloud tier pricing.


