View, query, and alert on outliers
After creating an outlier detector, you can access it from the Outlier detection page.
This page explains how to analyze outlier detectors, query their metrics, and configure alerts that trigger when outliers are detected.
View the outlier detection
In the Outlier detection page, click on the row or View button. This page includes:
- The outlier detector settings
- The Graph, which displays all returned series and highlights series containing outliers
- A Summary section that identifies series with outliers. Click any series to highlight it in the graph.

Tip
You can explore this outlier detection example in Grafana Play.
Query the outliers
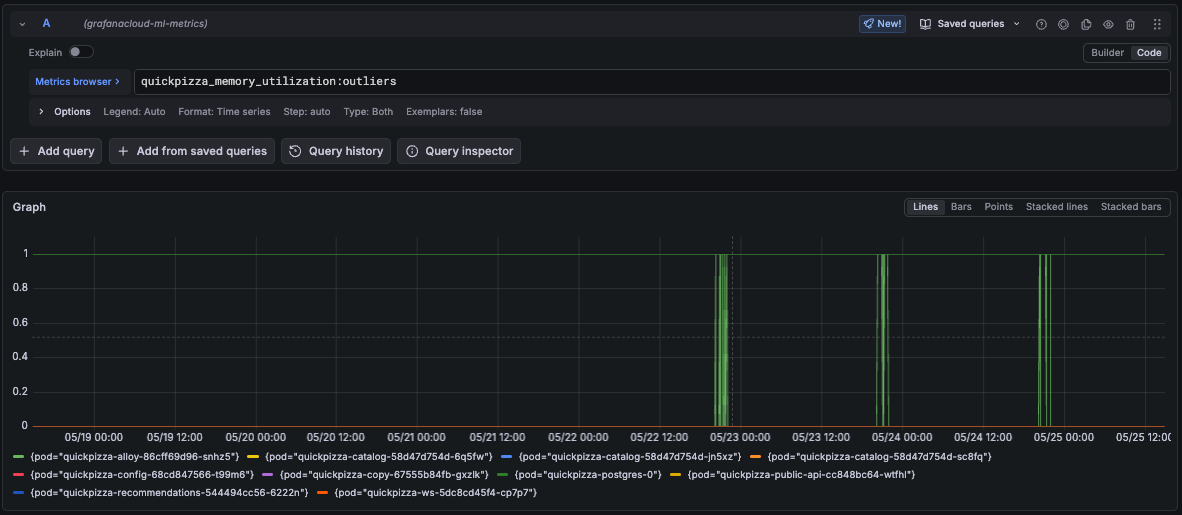
After creating an outlier detector, a new <outlier_detector_metric_name>:outliers metric is exposed in the grafanacloud-ml-metrics Prometheus data source.
The :outliers metric returns binary series indicating whether a series contains an outlier at a given moment:
1indicates an outlier0indicates standard behavior
Metric labels
Similar to forecast metric labels, outlier metrics include additional labels:
ml_algorithm: The outlier detector algorithmml_job_metric: The outlier detector metric name, equal to<outlier_detector_metric_name>ml_job_name: The outlier detector nameml_forecast: The value isoutlierfor outlier detectorsseries: The identifier of the series. It starts at0and increments for each returned series in the<outlier_detector_metric_name>metric.
Outlier metrics also include labels returned by the original detector query.
Alerting on outliers
You can create alert rules in Grafana Alerting that query the :outliers metric to detect when series in the group behave differently from the rest.
Note
Unlike forecasts, which periodically refresh forecast metrics, outlier detector metrics are refreshed on every query.
The following query fires an alert when any series in the group is detected as an outlier:
outlier_detector_metric_name:outliersQuery breakdown:
outlier_detector_metric_name:outliersreturns a binary series per group member:1when the series is an outlier,0otherwise- The alert fires for each series returning
1
To learn how alert rules that return multiple series work, refer to the Grafana Alerting documentation and the multi-dimensional alerting example.
Another detection method is to alert when more than 10% of the group behaves differently. You can modify the alert rule query as follows:
(
  sum(outlier_detector_metric_name_:outliers)
  /
  count(outlier_detector_metric_name_:outliers)
) > 0.10
Query breakdown:
sum(outlier_detector_metric_name:outliers)counts the number of series currently flagged as outlierscount(outlier_detector_metric_name:outliers)counts the total number of series in the group- Dividing the two returns the fraction of the group behaving as outliers
> 0.10fires the alert only when more than 10% of the group are outliers
Link alert rules to outlier detectors
You can create an alert rule in Grafana Alerting and associate it with an outlier detector by adding a custom annotation named grafana-ml-outlier-detector-id with the outlier detector ID as its value.
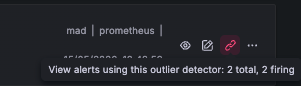
Alerts linked to outlier detectors are visible in the Outlier detection list: