View, query, and alert on forecasts
After a forecast has been created and trained, you can access it from the Metric Forecasts page.
This page explains how to view forecasts, query forecasted data, and configure alerts that compare real data against forecast predictions.
View your forecast
In the Metric Forecasts page, click on the forecast row or View button.
Tip
You can explore this forecast example in Grafana Play.
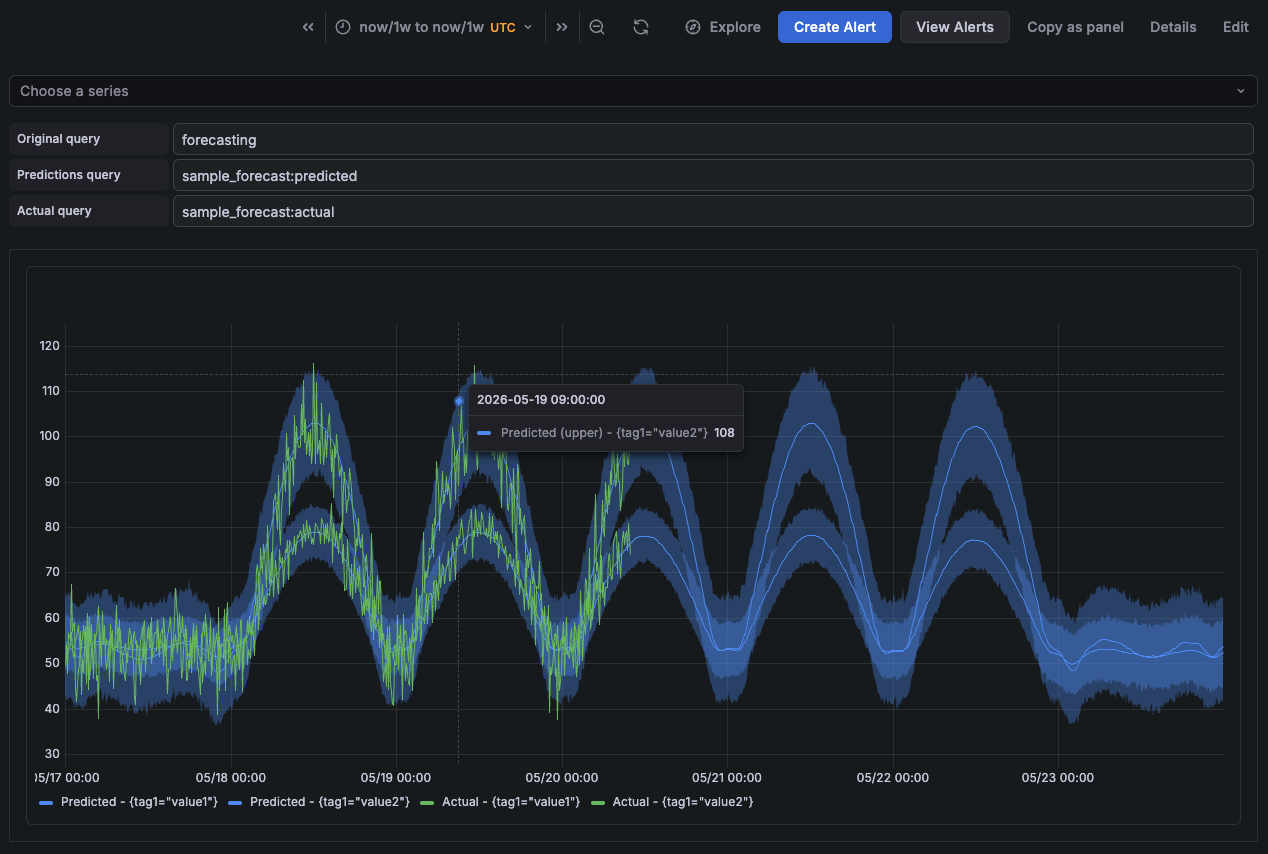
In the forecast view, you can select a time frame for the forecast. By default, the view shows the current week.
At the top of the chart, you can find the related forecast queries:
Original query: The original query defined in the forecast.
Prediction query: Query the
<forecast_metric_name>:predictedmetric.The prediction metric contains the forecast prediction and is updated after the model is trained.
The chart displays it as a blue line. The blue band represents the prediction interval, which is also influenced by the Uncertainty interval width option.
Actual query: Query the
<forecast_metric_name>:actualmetric.The actual metric returns the real observed values. It makes easier to display results and create alerts that compare real data against predicted data.
The chart displays it as a green line.
When the forecast contains multiple series, also referred to as dimensions or entities, use the Choose a series dropdown to filter results for a specific series.
Add forecasts to custom dashboards
You can also copy the forecast panel and add it to an existing dashboard:
- From the left sidebar, select AI & machine learning > Metric forecasts
- Select the forecast, and then click the Copy as panel button in the upper-right corner.
- Navigate to the dashboard where you want to add the panel.
- Click Edit in the top-right corner of the dashboard.
- From the right sidebar, click the + Add new element button and select Paste panel.
Query forecast metrics
For each forecast, Grafana Machine Learning generates three metrics in the grafanacloud-ml-metrics Prometheus data source: the predicted metric, the actual metric, and the anomalous metric.
Predicted metric
The <forecast_metric_name>:predicted metric reports the prediction interval and contains three series differentiated by the ml_forecast label.
# The predicted values
forecast_metric_name:predicted{ml_forecast="yhat"}

# The upper bound of the prediction interval
forecast_metric_name:predicted{ml_forecast="yhat_upper"}

# The lower bound of the prediction interval
forecast_metric_name:predicted{ml_forecast="yhat_lower"}
The range between the yhat_upper and yhat_lower bounds defines the prediction interval, represented as the blue band in the forecast chart. The prediction interval is also influenced by the Uncertainty interval width option.
The :predicted metric is fully recalculated every time the forecast retrains, including both historical and future forecasted values.
Forecasted data is available for up to half of the configured training data range. For example:
- With
90days of training data, the forecast provides45days of future forecasted data. - With
20days of training data, the forecast provides10days of future forecasted data.
Note
The training data range also determines the resolution of all generated forecast series, including predicted, actual, and anomalous metrics.
Actual metric
The <forecast_metric_name>:actual metric proxies the original query and returns the up-to-date data of the real values.
# The real values
forecast_metric_name:actual
The actual metric uses the {ml_forecast="y"} label. To compare predicted data against the real values, use ignoring (ml_forecast).
# Calculate the residual, or error, of a prediction
abs(
  forecast_metric_name:predicted{ml_forecast="yhat"} - ignoring (ml_forecast)
  forecast_metric_name:actual
)
Anomalous metric
The <forecast_metric_name>:anomalous metric evaluates the actual values against the prediction interval and returns a single series with the following values:
1when the actual value is above the predicted upper bound.-1when the actual value is below the predicted lower bound.0when the actual value is within the prediction interval.
Like the predicted metric, the anomalous metric is recalculated every time the forecast retrains, including both historical and future forecasted values.
For more information about how to use this metric, refer to Detect anomalies outside the forecast.
Metric labels
Forecast metrics also include the following labels:
ml_algorithm: The machine learning algorithm used by the forecast.ml_job_metric: The forecast metric name, equal to<forecast_metric_name>.ml_job_id: The forecast ID.ml_forecast: Identifies the forecast series:<forecast_metric_name>:predicted{ml_forecast="yhat"}: Predicted values<forecast_metric_name>:predicted{ml_forecast="yhat_upper"}: Upper bound of the prediction interval<forecast_metric_name>:predicted{ml_forecast="yhat_lower"}: Lower bound of the prediction interval<forecast_metric_name>:actual{ml_forecast="y"}: Real observed values<forecast_metric_name>:anomalous{ml_forecast="anomalies"}: Anomalous values detected by the forecast
Forecast metrics can also include:
- Custom labels configured in the forecast settings
- Labels returned by the original forecast query
Alerting on forecasts
You can create alert rules in Grafana Alerting that query forecast metrics to detect when real values deviate from predicted behavior.
Forecast alerts work like regular alert rules. Refer to the Grafana Alerting documentation to learn how alert rules work and how to configure them for your use case.
For instance, this alert query detects when the actual values exceed the predicted upper bound:
forecast_metric_name:actual >
bool ignoring(ml_forecast)
forecast_metric_name:predicted{ml_forecast="yhat_upper"}
Query breakdown:
forecast_metric_name:actualis the real observed metric value.forecast_metric_name:predicted{ml_forecast="yhat_upper"}is the upper prediction bound.ignoring(ml_forecast)matches both series by ignoring theml_forecastlabel, which differs between the series.> boolperforms a boolean comparison and returns:1when the actual value exceeds the upper bound. This fires the alert.0otherwise.
For comparison, this query detects when the actual values fall below the predicted lower bound:
forecast_metric_name:actual <
bool ignoring(ml_forecast)
forecast_metric_name:predicted{ml_forecast="yhat_lower"}
Alternatively, you can detect values outside the prediction interval querying the anomalous metric.
Note
The predicted and anomalous metrics are recalculated whenever the forecast retrains, including historical values. As a result, past alert evaluations might not exactly reflect the current state of these metrics.
Link alert rules to forecasts
You can create an alert rule in Grafana Alerting and associate it with a forecast by configuring the following in the alert rule:
- A custom annotation named
grafana-ml-forecast-idwith the value of the forecast ID. - A custom label named
ml_job_idwith the value of the forecast ID.
Alerts linked to forecasts can then be accessed from Grafana Machine Learning.


