Model options
This page describes the available forecast model configuration options and provides guidance for tuning individual settings.
For instructions about the standard forecast options and how to create a forecast, refer to Create a forecast.
Uncertainty Interval Width
- Default: 0.95
- Minimum: 0.01
- Maximum: 1
This option sets the confidence level for the prediction interval.
The default value of 0.95 means that 95% of future data should fall within the prediction interval. A value of 0.9 refers to 90%.
In the forecast chart, the prediction interval is represented as the blue band. It’s provided by the {ml_forecast="yhat_upper"} and {ml_forecast="yhat_lower"} predicted series.
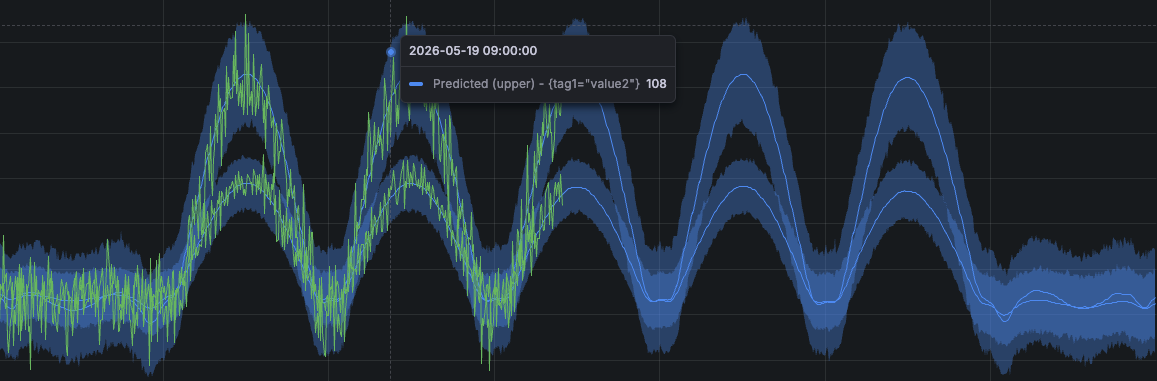
The prediction interval is influenced by both this option and the model’s estimation based on your data. A wider prediction interval reflects greater uncertainty in the forecast.
Trend Upper and Lower Limits
By default, predictions can grow without limits, which may produce unrealistic values for signals with natural limits. For instance, a percentage should not exceed 100 or a counter that cannot go below 0.
Setting upper and lower limits causes the prediction to never exceed these limits.
Trend Mode
- Default: Auto
- Options: Auto, Custom, Off
When set to Auto the series is assumed to have some trend component. Trend changepoints will be automatically detected in the first 80% of the data and are given a relatively weak weight in the model.
Set this option to Custom to expose two further options:
- Changepoint range determines the proportion of data in which changepoints should be detected. For example, setting this to 0.5 would detect changepoints in the first 50% of the data.
- Changepoint prior determines the weight given to changepoints in the model. Increasing this will allow changepoints to have a larger effect on the forecasts. Set this to a very low number to effectively disable changepoint detection.
Set this option to Off to disable the trend component entirely.
Daily Seasonality
- Default: Auto
- Options: Auto, Off, Custom
By default, daily seasonality is enabled if the query has at least two days of data.
You can set this option to Custom to customise the amount of detail modeled by the daily seasonality. This may be useful if your data shows strong daily patterns.
Set this option to Off to disable daily seasonality entirely.
Weekly Seasonality
- Default: Auto
- Options: Auto, Off, Custom
By default, weekly seasonality is enabled if the query has at least two weeks of data.
You can also set this option to Custom to customise the amount of detail modeled by the weekly seasonality. This may be useful if your data shows strong weekly patterns.
Set this option to Off to disable weekly seasonality entirely.
Seasonality Prior Scale
- Default: 10
- Minimum: 0.01
- Maximum: 10
Controls the weight given to daily and weekly seasonalities in the models forecasts. Increasing this value will cause the model to follow seasonal trends more strongly.
Seasonality Mode
- Default: Additive
- Options: Additive, Multiplicative
How seasonality is applied to the trend to form the final forecast. Set to Multiplicative if it appears that the magnitude of seasonal fluctuations grows with the magnitude of the time series.
Data Range
- Default: 90 days
- Maximum: 5 years
How far back in time to look for training data.
This range should not be greater than the retention period of the underlying data source, as no data would be returned beyond it.
Forecast horizon
The data range determines the forecast horizon. Forecasted data is available for up to half of the training data range. For example:
- With
90days of training data, the forecast provides45days of future forecasted data. - With
20days of training data, the forecast provides10days of future forecasted data.
Resolution and sampling
The data range determines the resolution of both the training data and the generated predictions.
Larger data ranges result in larger resolutions, also referred to as steps or intervals.
The total number of samples is calculated as data range ÷ interval. The system selects the smallest supported interval (1m, 5m, or 1h) that keeps the total number of samples at or below 60,480.
For example, 90 days of training data use a 5m interval, resulting in 25,920 samples:
(90 days × 24h × 60m) ÷ 1m = 129,600samples (higher than60,480, discarded)(90 days × 24h × 60m) ÷ 5m = 25,920samples (selected)


