Get started with forecasting
Forecasting predicts where a signal is heading based on historical patterns. It can analyze both business and observability data to help you:
- Predict future demand
- Prevent capacity issues
- Analyze seasonal trends
- Set goals relative to a baseline
- Detect potential anomalies
The following sections walk you through how to create forecasts in Grafana Cloud.
Create a forecast
To create a forecast, you need an Editor or Admin basic role.
Then, click AI & machine learning -> Metric Forecasts + New Forecast.
Choose a signal
Decide on the signal that you want to forecast. For example: memory consumption, inventory levels, or traffic rate.
- In the query builder, choose one of the supported data sources that provides the signal.
- Define the query for the selected signal.
Note
You can also choose a signal that applies to a group of entities. In this case, each entity is forecast independently.
The forecast query must return independent series uniquely identified by their label sets. For example, a query can return per-pod series identified by the
podlabel.
Preview and tune the forecast
In the next step, you can tune the forecast model to better detect the existing patterns in your data.
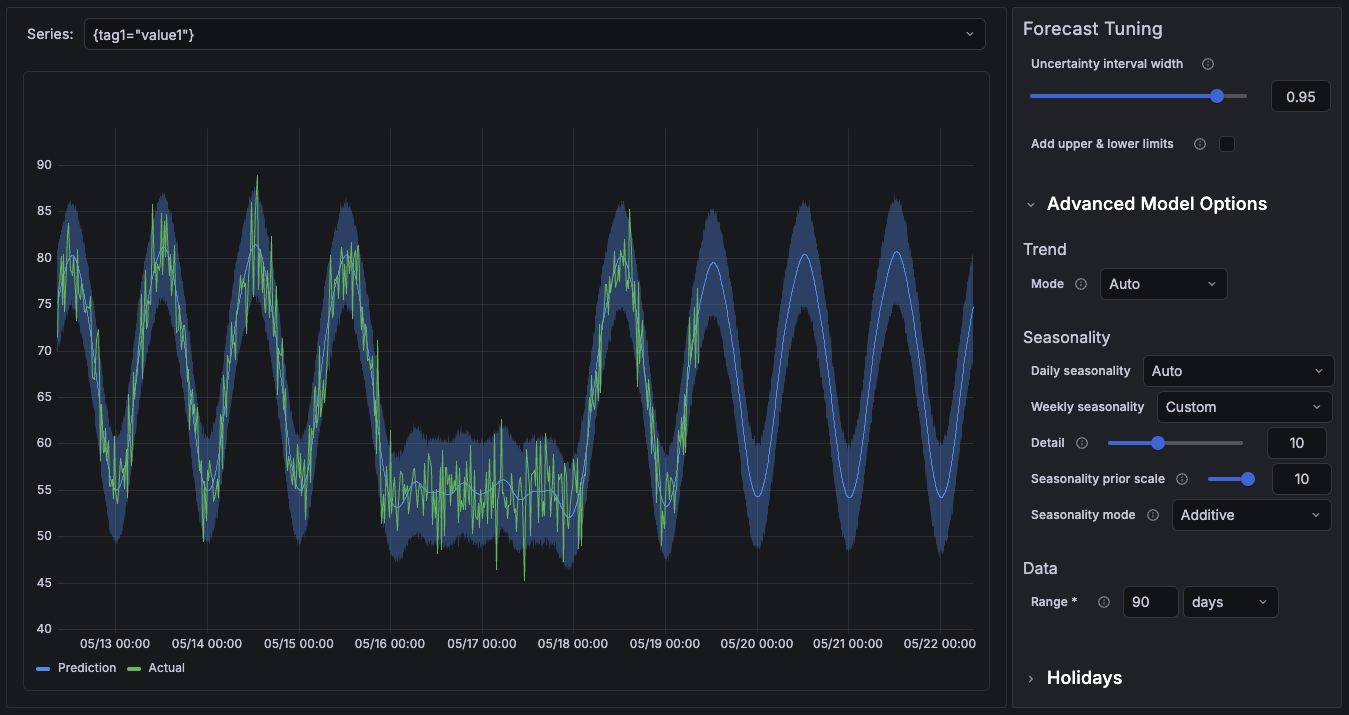
The forecast preview updates in real time as you adjust the model options. However, this preview is an approximation and might differ slightly from the final trained forecast.
The default model assumes that the signal follows an existing trend and that the data does not change abruptly over short periods.
For a standard setup, consider adjusting the following options:
Training data: The model uses 90 days of training data by default.
Uncertainty Interval Width: Controls the width of the prediction interval. The default value of 0.95 means that 95% of future data is expected to fall within the predicted interval.
For more advanced setups, refer to Model options.
Configure seasonality
By default, the model automatically detects daily and weekly seasonality when the training data contains at least two days or two weeks of data respectively.
However, some seasonal or external events might not be detected automatically. For example:
- Data backups that run on the last day of the month
- Traffic spikes associated with campaigns or holidays
If these events are not explicitly configured, one of the following can happen:
- The model incorporates the spikes into the baseline, resulting in biased predictions.
- The model cannot properly account for spikes associated with these events, resulting in inaccurate predictions and spurious alerts.
To improve forecast accuracy for these events, configure holidays. Holidays help the model recognize that specific spikes are associated with these events and account for them during the prediction period.
Set name and additional options
Enter a forecast Name and Description.
For each forecast, Grafana Machine Learning generates two metrics in the grafanacloud-ml-metrics Prometheus data source:
<forecast_metric_name>:predicted<forecast_metric_name>:actual
In this section, you can edit the <forecast_metric_name> name and set Custom labels to add to the generated forecast metrics. You can also enable alerts for the forecast with the Create forecast alert option.
Finally, click Next: Review to verify the forecast settings, and then click Create forecast.
The forecast is ready when its status changes to Ready on the Metric forecasts page.
Retrain forecasts
Grafana Machine Learning periodically retrains forecasts to keep predictions aligned with the latest signal updates.
Forecasts are retrained in these cases:
- Automatically every 24 hours.
- Manually by clicking Retrain forecast from the Metric forecasts list.
- Automatically when you update forecast settings such as the algorithm, data range, interval, or holidays.
Next steps
After the forecast is ready, you can use the generated forecast metrics to analyze future trends, detect anomalies, and create predictive alerts.
View, query, and alert on forecasts
Learn how to query forecast metrics, visualize predicted values alongside real data, and configure alerts based on actual values compared to forecast data.
Detect anomalies outside the forecast
Learn how to identify when real values fall outside the predicted forecast range to detect anomalies or unexpected behavior.


