Grafana Machine Learning
Grafana Cloud provides machine learning capabilities for monitoring and alerting workflows.
With support for data sources such as Prometheus and Postgres, you can forecast trends, detect anomalies, and identify outliers in your data. You can also configure alerts that compare real data against machine learning insights to detect potential issues early.
Forecasting
Metric forecasting predicts where a signal is heading based on its historical patterns. It works with business and observability data, and performs best for signals with stable trends or seasonal patterns such as daily or weekly traffic.
Use forecasting to predict future behavior, plan resource capacity, or detect anomalies and unusual patterns.

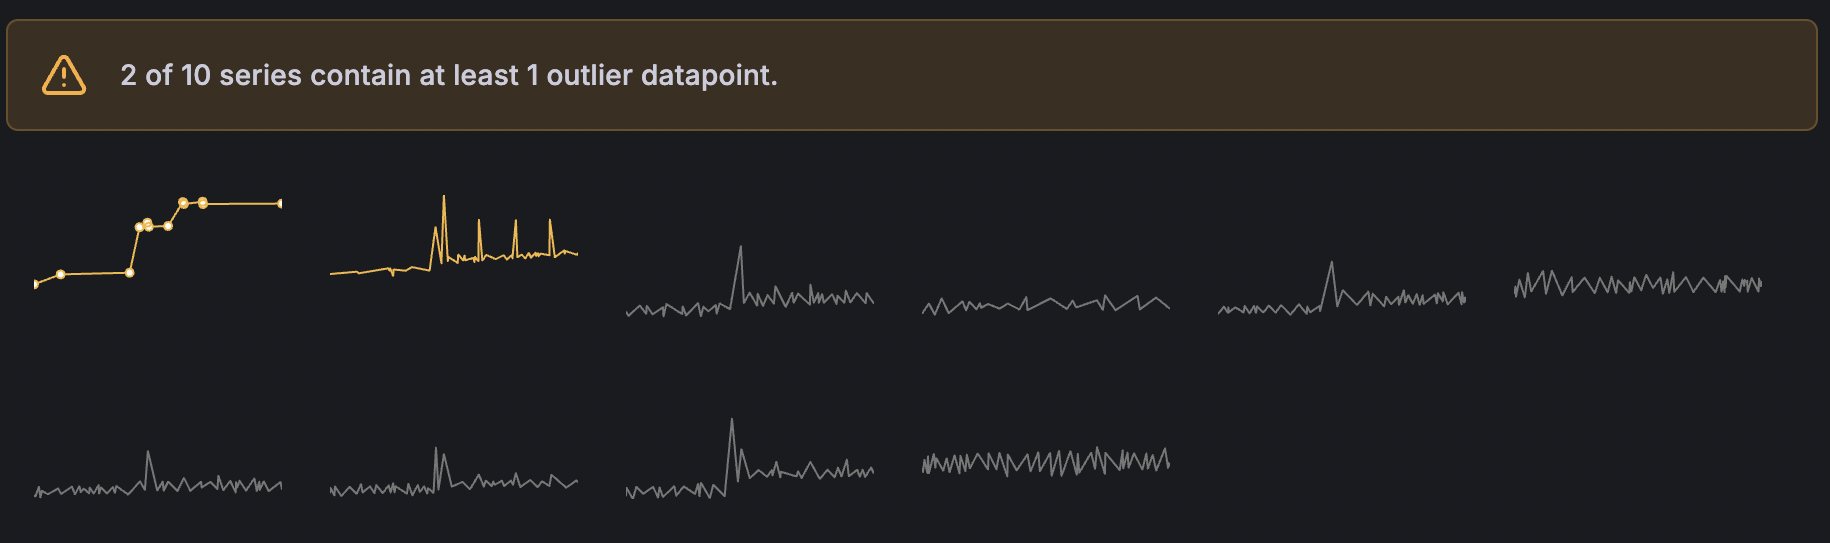
Detect outliers in a group
Outlier detectors continuously analyze metrics to identify when members of a group behave differently from the rest. For example, they can detect when a single instance consumes significantly more resources than its peers, when multiple services degrade in parallel, or when one ore more business units behave differently from similar groups.
Use these insights to optimize systems, investigate unexpected behavior, or receive alerts before issues escalate.
Supported data sources
Metric forecasting and outlier detection support a wide range of data sources:
- Prometheus
- Graphite
- Loki (metric queries only)
- Postgres
- InfluxDB
- Snowflake
- Splunk
- Elasticsearch
- BigQuery
- MongoDB
- Datadog
Sift investigations
Sift is a diagnostic assistant powered by machine learning algorithms that automatically surfaces potential causes of incidents in Kubernetes infrastructure.
For prompt-based, agent-driven investigations across all signals, refer to Grafana Assistant investigations.
Billing
Grafana ML features and capabilities, including metric forecasting, outlier detection, and Sift, are free to use with all Grafana Cloud accounts. Metrics generated by Grafana ML do not count toward billable active series in Grafana Cloud Metrics.
For current limitations, refer to Usage limits for Grafana Machine Learning.


