Install Prometheus Operator with Grafana Cloud for Kubernetes
You can install Prometheus Operator in a Kubernetes Cluster, configure it to scrape an endpoint, and send scraped metrics to Grafana Cloud.
Prometheus Operator implements the Kubernetes Operator pattern for managing a Prometheus-based Kubernetes monitoring stack. A Kubernetes Operator consists of Kubernetes custom resources and Kubernetes controller code. Together, these abstract away the management and implementation details of running a given service on Kubernetes. For more about Kubernetes Operators, refer to the Operator pattern.
The Prometheus Operator installs a set of Kubernetes custom resources that simplify Prometheus deployment and configuration. For example, when you use the ServiceMonitor custom resource, you can configure how to monitor Kubernetes services in Kubernetes YAML manifests instead of Prometheus configuration code. The Operator controller then communicates with the Kubernetes API server to add service /metrics endpoints and automatically generate the required Prometheus scrape configurations for the configured services. To learn more, refer to Prometheus Operator.
Configuration steps
The steps for configuration are:
- Install Prometheus Operator into the Kubernetes Cluster.
- Configure RBAC permissions for Prometheus.
- Deploy Prometheus into the Cluster using the Operator.
- Expose the Prometheus server as a service.
- Create a ServiceMonitor.
Before you begin
Before you begin, have the following items available to you:
- A Kubernetes
>=1.16.0Cluster with role-based access control (RBAC) enabled - A Grafana Cloud account
- A Grafana Cloud access policy token with the
metrics:writescope. To create a Grafana Cloud access policy, refer to Create a Grafana Cloud Access Policy. - The
kubectlcommand-line tool installed on your local machine and configured to connect to your Cluster. Refer to installkubectl.
Install Prometheus Operator
Install Prometheus Operator into the Kubernetes Cluster. This includes all of Prometheus Operator’s Kubernetes custom resource definitions (CRDs) that define the Prometheus, Alertmanager, and ServiceMonitor abstractions used to configure the monitoring stack. In this step, you also deploy a Prometheus Operator controller into the Cluster.
Note
With these instructions, you install everything into the
defaultNamespace. To install Prometheus Operator into another Namespace, refer to the Prometheus Operator.
Install the Operator using the
bundle.yamlfile in the Prometheus Operator GitHub repository:kubectl create -f https://raw.githubusercontent.com/prometheus-operator/prometheus-operator/master/bundle.yamlYou should see the following output:
customresourcedefinition.apiextensions.k8s.io/alertmanagerconfigs.monitoring.coreos.com created customresourcedefinition.apiextensions.k8s.io/alertmanagers.monitoring.coreos.com created customresourcedefinition.apiextensions.k8s.io/podmonitors.monitoring.coreos.com created customresourcedefinition.apiextensions.k8s.io/probes.monitoring.coreos.com created customresourcedefinition.apiextensions.k8s.io/prometheuses.monitoring.coreos.com created customresourcedefinition.apiextensions.k8s.io/prometheusrules.monitoring.coreos.com created customresourcedefinition.apiextensions.k8s.io/servicemonitors.monitoring.coreos.com created customresourcedefinition.apiextensions.k8s.io/thanosrulers.monitoring.coreos.com created clusterrolebinding.rbac.authorization.k8s.io/prometheus-operator created clusterrole.rbac.authorization.k8s.io/prometheus-operator created deployment.apps/prometheus-operator created serviceaccount/prometheus-operator created service/prometheus-operator createdbundle.yamlinstalls CRDs for Prometheus objects as well as a Prometheus Operator controller and service.Note: With these instructions, you install everything into the
defaultNamespace. To install Prometheus Operator into another Namespace, refer to the Prometheus Operator documentation.Verify that the Prometheus Operator installation succeeded by using
kubectl:kubectl get deployNAME READY UP-TO-DATE AVAILABLE AGE prometheus-operator 1/1 1 1 3m21s
Configure Prometheus RBAC Permissions
Configure RBAC privileges for the Prometheus server using a ClusterRole. Then bind this ClusterRole to a ServiceAccount using a ClusterRoleBinding object.
Prometheus needs Kubernetes API access to discover targets and pull ConfigMaps. For more about permissions granted in this section, refer to RBAC.
Create a directory to store any Kubernetes manifests used in these instructions, and
cdinto it:mkdir operator_k8s cd operator_k8sCreate a manifest file called
prom_rbac.yamlusing an editor, and paste in the following Kubernetes manifest:apiVersion: v1 kind: ServiceAccount metadata: name: prometheus --- apiVersion: rbac.authorization.k8s.io/v1beta1 kind: ClusterRole metadata: name: prometheus rules: - apiGroups: [""] resources: - nodes - nodes/metrics - services - endpoints - pods verbs: ["get", "list", "watch"] - apiGroups: [""] resources: - configmaps verbs: ["get"] - apiGroups: - networking.k8s.io resources: - ingresses verbs: ["get", "list", "watch"] - nonResourceURLs: ["/metrics"] verbs: ["get"] --- apiVersion: rbac.authorization.k8s.io/v1beta1 kind: ClusterRoleBinding metadata: name: prometheus roleRef: apiGroup: rbac.authorization.k8s.io kind: ClusterRole name: prometheus subjects: - kind: ServiceAccount name: prometheus namespace: defaultThis creates a ServiceAccount called
prometheusand binds it to theprometheusClusterRole. The manifest grants the ClusterRoleget,list, andwatchKubernetes API privileges.Save and close the manifest when editing is complete.
Create the objects using
kubectl:kubectl apply -fserviceaccount/prometheus created clusterrole.rbac.authorization.k8s.io/prometheus created clusterrolebinding.rbac.authorization.k8s.io/prometheus created
Now that Prometheus has Kubernetes API access, you can deploy it into the Cluster.
Deploy Prometheus
In this step, you launch a 2-replica HA Prometheus deployment into your Kubernetes Cluster using a Prometheus resource defined by Prometheus Operator. This Prometheus resource encodes domain-specific Prometheus configuration into a set of readily configurable YAML fields. Instead of managing Prometheus configuration files and learn Prometheus configuration syntax, you can toggle many important configuration parameters by modifying Prometheus object variables in a Kubernetes manifest.
Create a file called
prometheus.yaml, and paste in the following manifest:apiVersion: monitoring.coreos.com/v1 kind: Prometheus metadata: name: prometheus labels: app: prometheus spec: image: quay.io/prometheus/prometheus:v2.22.1 nodeSelector: kubernetes.io/os: linux replicas: 2 resources: requests: memory: 400Mi securityContext: fsGroup: 2000 runAsNonRoot: true runAsUser: 1000 serviceAccountName: prometheus version: v2.22.1 serviceMonitorSelector: {}Notice that
kindis set toPrometheusand notDeploymentorPod. ThePrometheusresource abstracts away the underlying controllers and ConfigMaps into streamlined objects used to manipulate Prometheus infrastructure components.The manifest:
- Names the
Prometheusresourceprometheus. - Gives it an
app: prometheuslabel. - Sets the container image used to run Prometheus.
- Restricts its deployment to Linux nodes.
- Ensures each replica has
400Miof memory available to it. - Configures its Security Context. To learn more, refer to Configure a Security Context for a Pod or Container.
- Sets the ServiceAccount it will use.
- Sets the Prometheus version.
- Instructs Prometheus to automatically pick up all configured
ServiceMonitorresources using{}. You’ll create aServiceMonitorto get Prometheus to scrape its own metrics.
- Names the
Save and close the file.
Deploy the manifest into your Cluster using
kubectl apply -f:kubectl apply -fprometheus.monitoring.coreos.com/prometheus createdNote: You deployed Prometheus into the
defaultNamespace. To deploy Prometheus in another Namespace, use the-n namespace_nameflag withkubectlor set thenamespacefield for the resource in a Kubernetes manifest file.Verify the deployment using
kubectl get:kubectl get prometheusNAME VERSION REPLICAS AGE prometheus v2.22.1 2 32sCheck the underlying Pods using
get pod:kubectl get podNAME READY STATUS RESTARTS AGE prometheus-operator-79cd654746-mdfp6 1/1 Running 0 33m prometheus-prometheus-0 2/2 Running 1 57s prometheus-prometheus-1 2/2 Running 1 57s
Prometheus is up and running in the Cluster.
Create a Prometheus service
Expose Prometheus using a service. To create the Prometheus service:
Open a manifest file called
prom_svc.yamland paste in the following definitions:apiVersion: v1 kind: Service metadata: name: prometheus labels: app: prometheus spec: ports: - name: web port: 9090 targetPort: web selector: app.kubernetes.io/name: prometheus sessionAffinity: ClientIPThis manifest configures:
- Sets the service name to
prometheus. - Creates an
app: prometheusServicelabel. - Exposes port
9090on a Cluster-wide stable IP address and forwards it to the two Prometheus Pods at their defaultwebport (9090). - Selects the Prometheus Pods as targets using the
app: prometheuslabel. - Uses
sessionAffinity: ClientIPto ensure that connections from a particular client get forwarded to the same Pod.
- Sets the service name to
Save and close the file.
Create the service using
kubectl apply -f:kubectl apply -f prom_svc.yamlservice/prometheus createdCheck your work using
kubectl get:kubectl get serviceNAME TYPE CLUSTER-IP EXTERNAL-IP PORT(S) AGE kubernetes ClusterIP 10.245.0.1 <none> 443/TCP 27h prometheus ClusterIP 10.245.106.105 <none> 9090/TCP 26h prometheus-operated ClusterIP None <none> 9090/TCP 8m52s prometheus-operator ClusterIP None <none> 8080/TCP 41mThe
prometheusservice is up and running.To access the Prometheus server, forward a local port to the Prometheus service running inside of the Kubernetes Cluster:
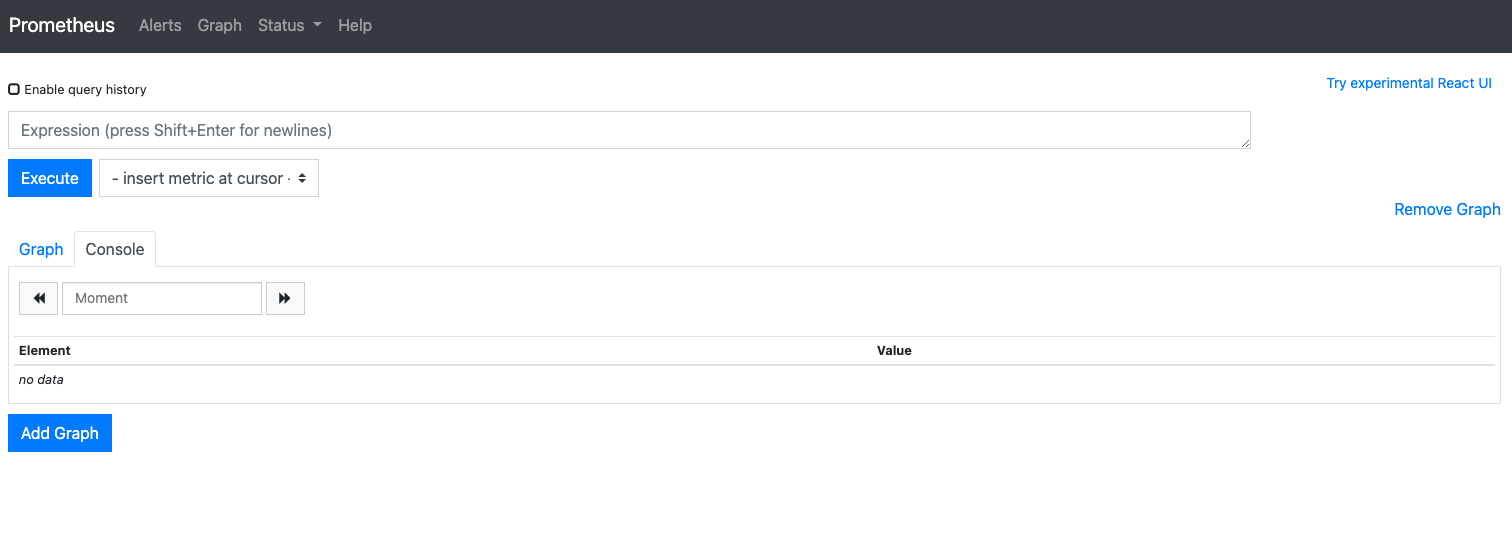
kubectl port-forward svc/prometheus 9090Forwarding from 127.0.0.1:9090 -> 9090 Forwarding from [::1]:9090 -> 9090Navigate to
http://localhost:9090to access the Prometheus interface:![Prometheus UI]()
Click Status, then Targets to see any configured scrape targets.
This should be empty, as nothing is configured to scrape.
Create a Prometheus ServiceMonitor
Create a ServiceMonitor so that the Prometheus server scrapes its own metrics endpoint. A ServiceMonitor defines a set of targets for Prometheus to monitor and scrape. Prometheus Operator abstracts away the implementation details of configuring Kubernetes service discovery and scrapes targets using this ServiceMonitor resource.
Instead of modifying a Prometheus configuration file, update a ConfigMap object and deploy the new configuration so that Prometheus Operator automatically hooks in new ServiceMonitors to your running Prometheus deployment.
To create the ServiceMonitor:
Create a file called
prometheus_servicemonitor.yaml, and paste in the following ServiceMonitor resource definition:apiVersion: monitoring.coreos.com/v1 kind: ServiceMonitor metadata: name: prometheus-self labels: app: prometheus spec: endpoints: - interval: 30s port: web selector: matchLabels: app: prometheusThe resource definition configures the following:
- Names the ServiceMonitor
prometheus-self. - Gives it an
app: prometheuslabel. - Sets the scrape interval to
30s, and scrapes thewebport (defined in theprometheusService). - Selects the
prometheusServiceto scrape using thematchLabelsselector withapp: prometheus.
- Names the ServiceMonitor
Save and close the file.
Deploy the using
kubectl apply -f:kubectl apply -f prometheus_servicemonitor.yamlservicemonitor.monitoring.coreos.com/prometheus-self createdPrometheus Operator should update your Prometheus configuration immediately. In some cases, you may need to wait a minute or so for changes to propagate.
Verify your updates
Forward a port to your Prometheus server and check its configuration for verification.
And replace with this one?
Find the name of the Prometheus service. This will be in the format <your_release_name>-kube-prometheus-stack-prometheus, but could be truncated to fit naming length restrictions.
kubectl --namespace default get serviceUse port-forward with that Prometheus service by running the following command:
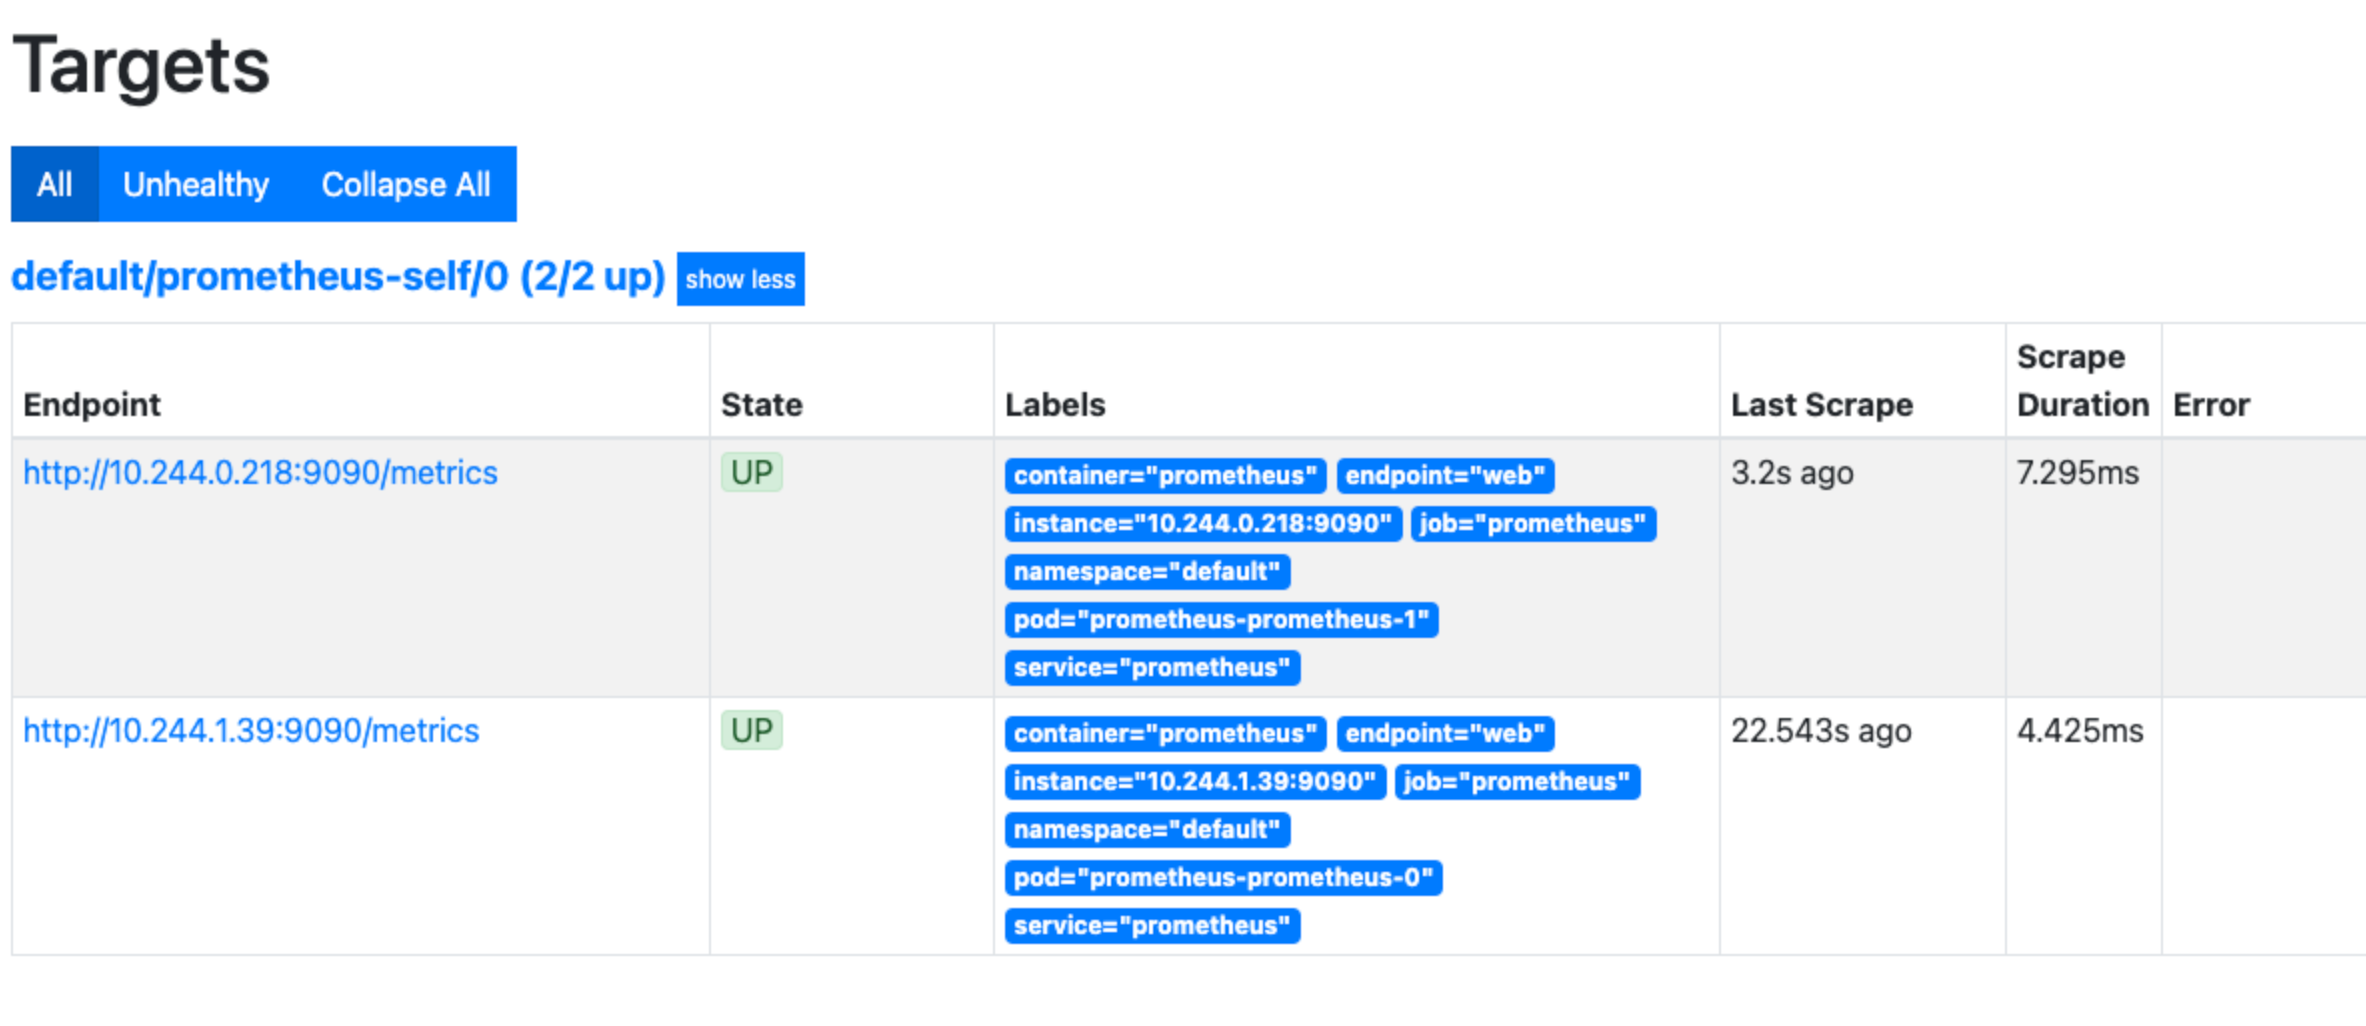
kubectl --namespace default port-forward svc/<prometheus service name> 9090Navigate to Status, and then Targets in the Prometheus interface:
![Prometheus Targets]()
You should see the two Prometheus replicas as scrape targets.
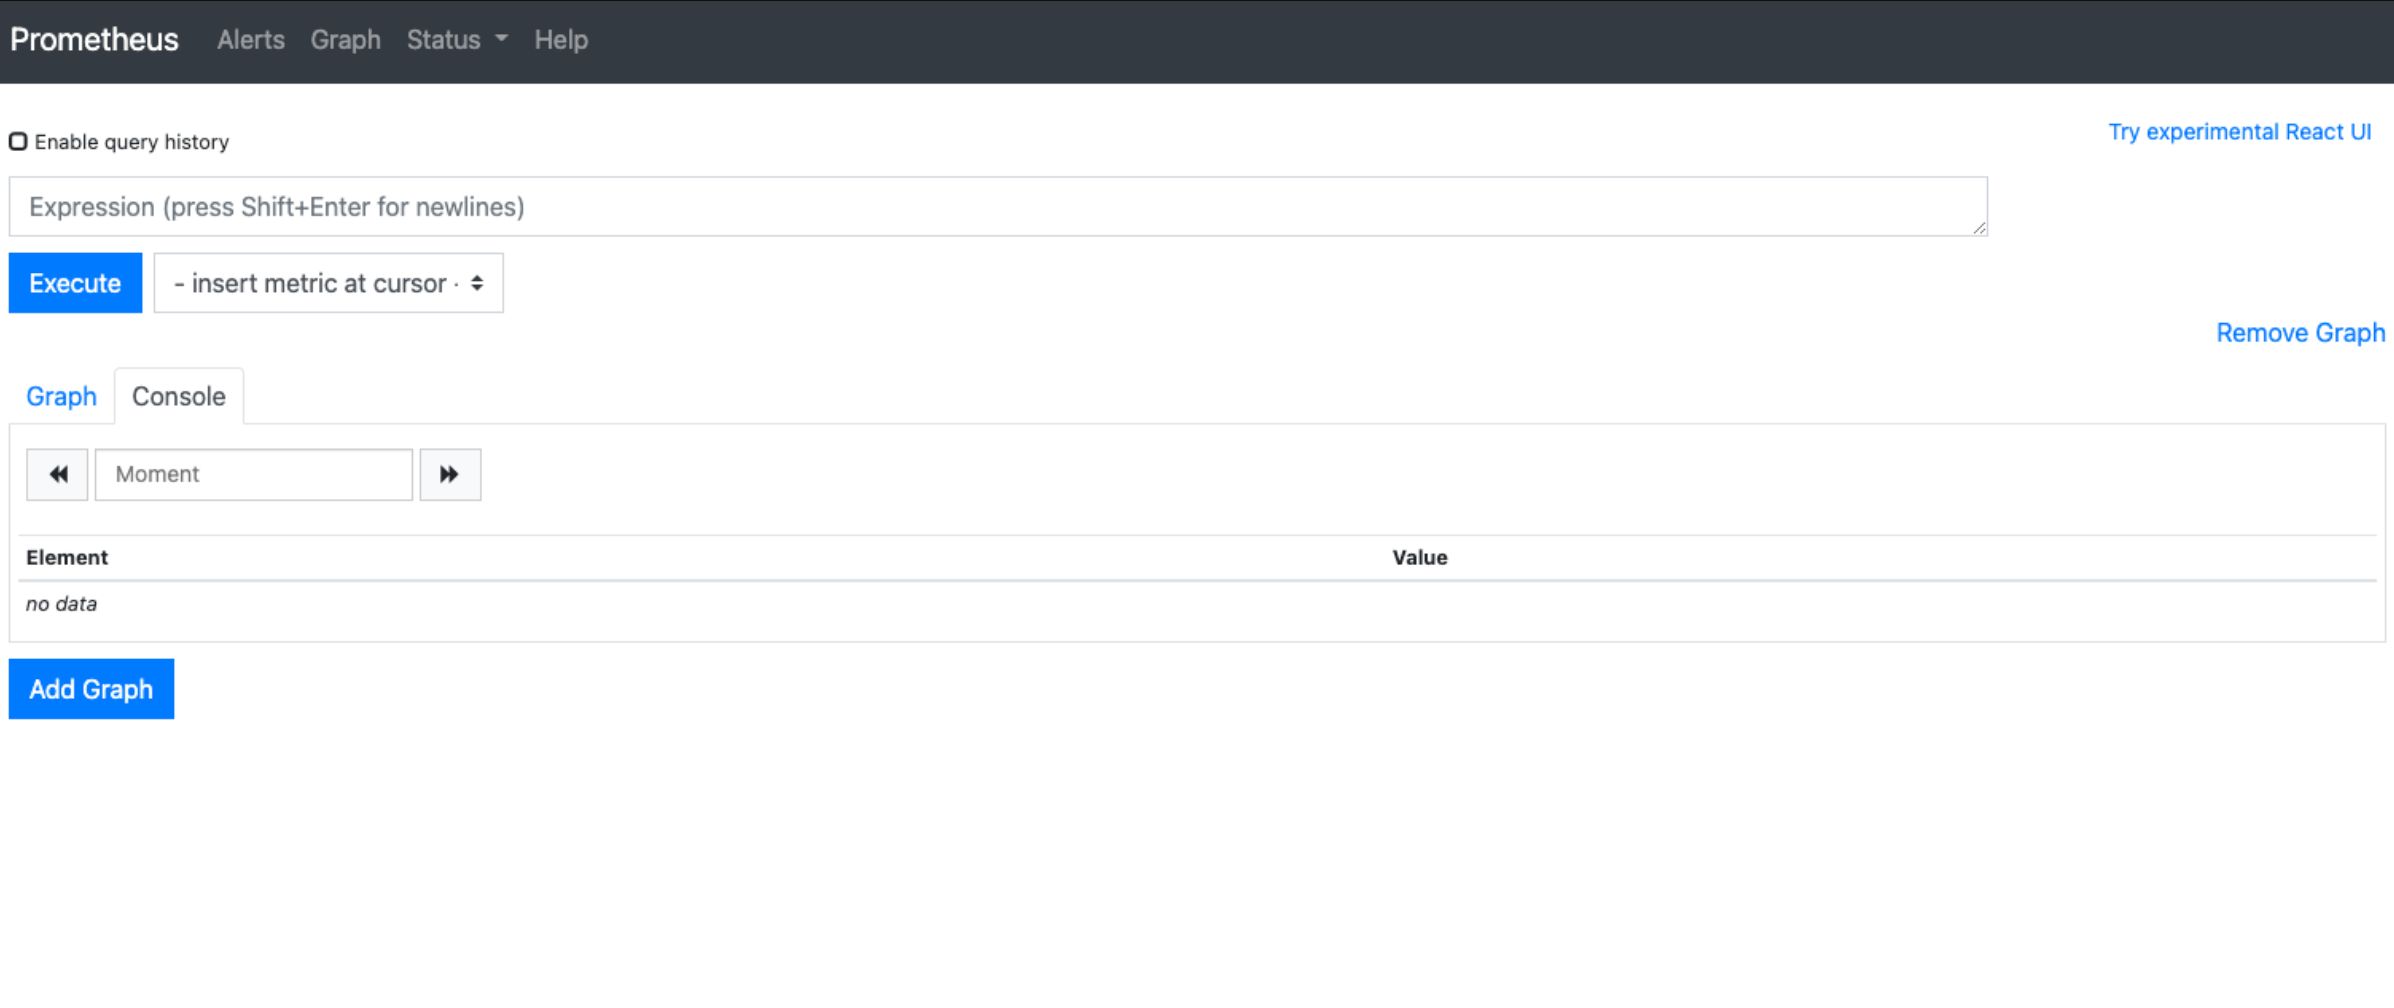
Navigate to Graph to test metrics collection:
![Prometheus Graph UI]()
In the Expression box, type
prometheus_http_requests_total, and pressENTER.You should see a list of scraped metrics and their values. These are HTTP request counts for various Prometheus server endpoints.
If you’re having trouble configuring a ServiceMonitor, refer to Troubleshooting ServiceMonitor Changes.
Now you have configured Prometheus to scrape itself and store metrics locally.
Create a Kubernetes Secret to store Grafana Cloud credentials
Configure Prometheus to send the scraped metrics to Grafana Cloud. Before configuring Prometheus’s remote_write feature to send metrics to Grafana Cloud, you must create a Kubernetes Secret to store your Grafana Cloud Metrics username and password.
To create the Secret:
Navigate to your stack in the Cloud Portal, and click Details next to the Prometheus panel to find your username.
Your password corresponds to a Cloud Access Policy token that you can generate by clicking on Generate now in this same panel. To create a Cloud Access Policy, refer to Create a Grafana Cloud Access Policy.
After noting your Cloud Prometheus username and password, you can create the Kubernetes Secret using a manifest file or directly using
kubectl. With these instructions, you create it directly usingkubectl. To learn more about Kubernetes Secrets, refer to Secrets.Run the following command to create a Secret called
kubepromsecret:kubectl create secret generic kubepromsecret \ --from-literal=username=<your_grafana_cloud_prometheus_username>\ --from-literal=password='<your_grafana_cloud_access_policy_token>'Note: If you deployed your monitoring stack in a namespace other than
default, append the-nflag with the appropriate namespace to the above command.For more about this command, refer to Managing Secrets using kubectl from the official Kubernetes documentation.
Configure Prometheus remote_write and metrics deduplication
Configure remote_write to send Cluster metrics to Grafana Cloud and to deduplicate metrics. The remote_write Prometheus feature allows you to send metrics to remote endpoints for long-term storage and aggregation. Grafana Cloud’s deduplication feature allows you to deduplicate metrics sent from high-availability Prometheus pairs, which reduces your active series usage. You enable remote_write by modifying the prometheus resource you created earlier.
To configure Prometheus remote_write and metrics deduplication:
Open the
prometheus.yamlmanifest using your editor:apiVersion: monitoring.coreos.com/v1 kind: Prometheus metadata: name: prometheus labels: app: prometheus spec: image: quay.io/prometheus/prometheus:v2.22.1 nodeSelector: kubernetes.io/os: linux replicas: 2 resources: requests: memory: 400Mi securityContext: fsGroup: 2000 runAsNonRoot: true runAsUser: 1000 serviceAccountName: prometheus version: v2.22.1 serviceMonitorSelector: {}Add the following section to the end of the resource definition:
. . .
  remoteWrite:
  - url: "<Your Metrics instance remote_write endpoint>"
    basicAuth:
      username:
        name: kubepromsecret
        key: username
      password:
        name: kubepromsecret
        key: password
  replicaExternalLabelName: "__replica__"
  externalLabels:
    cluster: "<choose_a_prom_cluster_name>"
The resource definition configures the following:
- Sets the
remote_writeURL corresponding to Grafana Cloud’s Prometheus metrics endpoint. To find the/api/prom/pushURL, username, and password for your metrics endpoint, click Details in the Prometheus card of the Cloud Portal. - Configures a
basicAuthusername and password that references the Secret created in the earlier step namedkubepromsecret - Selects the
usernameandpasswordkeys of this Secret - Configures Grafana Cloud metrics deduplication using the
replicaExternalLabelNameandexternalLabelsfields - Sets
clusterto a value that identifies your Prometheus HA Cluster. To learn more, refer to Deduplicating metrics data sent from high-availability Prometheus pairs.
- Sets the
Save and close the file.
Apply the changes using
kubectl apply -f:kubectl apply -f prometheus.yamlprometheus.monitoring.coreos.com/prometheus configuredAt this point, you’ve successfully configured your Prometheus instances to
remote_writescraped metrics to Grafana Cloud.Verify that your changes have propagated to your running Prometheus instances using
port-forward:kubectl port-forward svc/prometheus 9090Navigate to
http://localhost:9090in your browser, and then Status and Configuration. Verify that theremote_writeandexternal_labelsblocks you appended earlier have propagated to your running Prometheus instances.It may take a minute or two for Prometheus Operator to pick up the new configuration.
In the final step, you’ll query your Cluster metrics in Grafana Cloud.
Access your Prometheus metrics in Grafana Cloud
Now that your Prometheus instances send their scraped metrics to Grafana Cloud, you can query and visualize these metrics from the Grafana Cloud platform.
From the Cloud Portal, click Log In next to the Grafana card to log in to Grafana.
Click Explore in the left-side menu.
In the PromQL query box, enter the same metric you tested earlier,
prometheus_http_requests_total, and pressSHIFT + ENTER.You should see a graph of time-series data corresponding to different labels of the
prometheus_http_requests_totalmetric. Grafana queries this data from the Grafana Cloud Metrics data store, not your local Cluster.Navigate to Kubernetes Monitoring, and click Configuration on the main menu.
Click the Metrics status tab to view the data status. Your data begins populating in the view as the system components begin scraping and sending data to Grafana Cloud.

Metrics status tab with status indicators for one Cluster

Next steps
Now that you have installed and configured Prometheus Operator, you can:
- Create dashboards and panels to visualize and alert on this data. To learn more, refer to Dashboard overview and Panel overview.
- Add additional endpoints to scrape, such as the Kubernetes API or
kubeletmetrics from the Kubernetes nodes. To see a fully configured Prometheus Kubernetes stack in action, refer to kube-prometheus.


