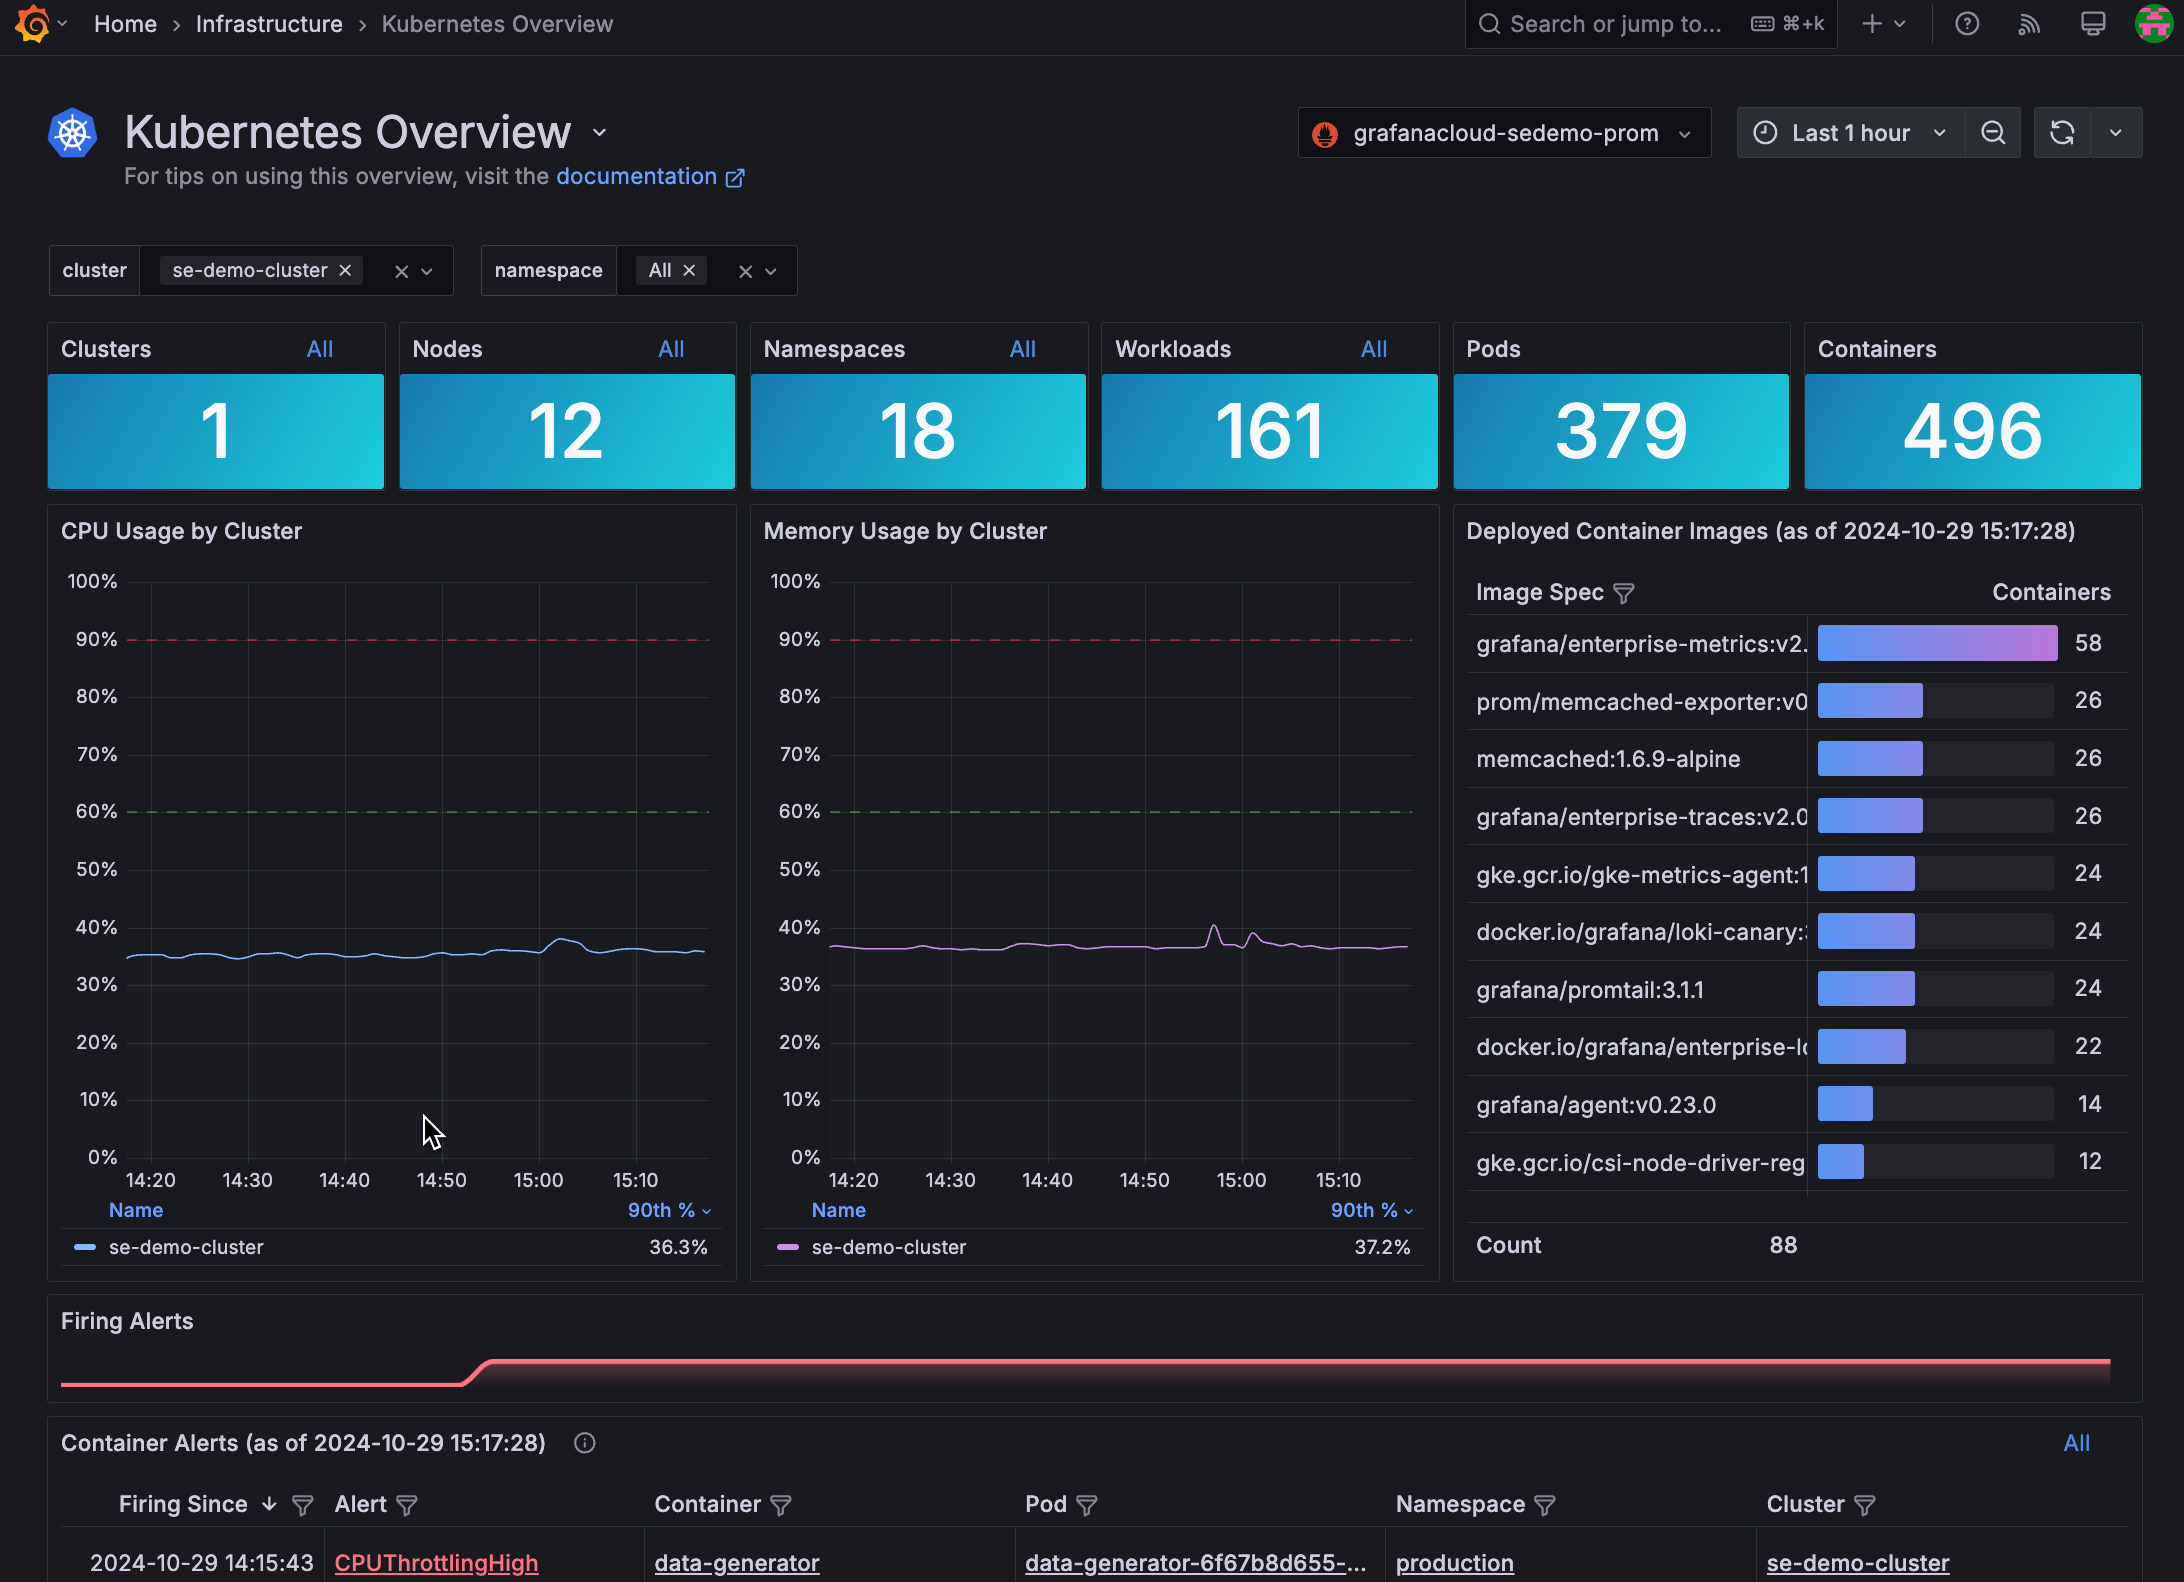
About Kubernetes Monitoring
Grafana Kubernetes Monitoring lets you view all of your Kubernetes data in one place. By shipping kube-state-metrics to Grafana Cloud, you can inspect the health of your clusters, containers, and pods with little or no required configuration. You can also access preconfigured dashboards, alert rules, and recording rules.
Get started
Select a question to learn more about Kubernetes Monitoring.
- How do I use Kubernetes Monitoring?
- What’s the easiest way to get started?
- What data is visible to me with Kubernetes Monitoring?
- How can I manage and track metrics and logs coming through Kubernetes Monitoring?
- I’m already sending kube-state-metrics to Prometheus - do I still need to use Grafana Agent?
- How can I migrate to Kubernetes Monitoring from an older integration?
- Does Grafana Cloud support integrations on Kubernetes?
- Can I monitor Kubernetes events?
- Where can I get help with installing the Agent Operator?
- Where can I get help with Kubernetes Monitoring?
How do I use Kubernetes Monitoring?
With Kubernetes Monitoring, you can explore your infrastructure by navigating through the object model. For a tour, see Navigate Kubernetes Monitoring.
What’s the easiest way to get started?
To get started monitoring Kubernetes quickly, use the Kubernetes Monitoring interface. See Configure Kubernetes Monitoring to get started.
Note: You should have only one job scraping
kube-state-metrics
. If you have multiple scrape jobs running at the same time, you might see an error similar to the following when you try to view objects in Cluster navigation:execution: found duplicate series for the match group...
What data is visible to me with Kubernetes Monitoring?
Kubernetes Monitoring provides logs and metrics related to your Kubernetes infrastructure and resource usage. We use kube-state-metrics to generate metrics from Kubernetes objects without modification. We use Loki to collect logs from the Kubernetes objects.
Specifically, Kubernetes Monitoring give you access to the following:
Component | Description |
---|---|
Manifests | Preconfigured manifests for deploying Grafana Agent, Grafana’s telemetry collector, and kube-state-metrics to your clusters. See kube-state-metrics to learn which kube-state-metrics are scraped by default with Kubernetes Monitoring. |
Dashboards | Nine Grafana dashboards to drill into resource usage and cluster operations, from the multi-cluster level down to individual containers and Pods. |
Recording rules | A set of recording rules to speed up dashboard queries. |
Alerting rules | A set of alerting rules to alert on conditions. For example: Pods crash looping and Pods getting stuck in “not ready” status. |
Allowlist | An optional preconfigured allowlist of metrics referenced in the above dashboards, recording rules, and alerting rules to reduce your active series usage while still giving you visibility into core cluster metrics. |
Events | Grafana Agent can configure an eventhandler integration to watch for Kubernetes Events in your clusters. |
We are heavily indebted to the open source kubernetes-mixin project, from which the dashboards, recording rules, and alerting rules have been derived. We will continue to contribute bug fixes and new features upstream.
kube-state-metrics
The following metrics are required to use the Kubernetes Monitoring Cluster navigation feature:
- kube_namespace_status_phase
- container_cpu_usage_seconds_total
- kube_pod_status_phase
- kube_pod_start_time
- kube_pod_container_status_restarts_total
- kube_pod_container_info
- kube_pod_container_status_waiting_reason
- kube_daemonset.\*
- kube_replicaset.\*
- kube_statefulset.\*
- kube_job.\*
- kube_node*
- kube_cluster*
- node_cpu_seconds_total
- node_memory_MemAvailable_bytes
- node_filesystem_size_bytes
- node_namespace_pod_container
- container_memory_working_set_bytes
- job="integrations/kubernetes/eventhandler" (for event logs, comes default with Grafana agent)
NOTE: Logs are not required for Kubernetes Monitoring to work, but they provide additional context in some views of the Cluster Navigation tab. Log entries must be shipped to a Loki data source with
cluster
,namespace
, andpod
labels.
Alerting Rules
The following alerting rules are preconfigured to help you get up and running with Grafana Cloud alerts. You will be notified when issues arise with your clusters and their workloads.
Kubelet alerts
KubeNodeNotReady
KubeNodeUnreachable
KubeletTooManyPods
KubeNodeReadinessFlapping
KubeletPlegDurationHigh
KubeletPodStartUpLatencyHigh
KubeletClientCertificateExpiration
KubeletServerCertificateExpiration
KubeletClientCertificateRenewalErrors
KubeletServerCertificateRenewalErrors
KubeletDown
Kubernetes system alerts
KubeVersionMismatch
KubeClientErrors
Kubernetes resource usage alerts
KubeCPUOvercommit
KubeMemoryOvercommit
KubeCPUQuotaOvercommit
KubeMemoryQuotaOvercommit
KubeQuotaAlmostFull
KubeQuotaFullyUsed
KubeQuotaExceeded
CPUThrottlingHigh
Kubernetes alerts
KubePodCrashLooping
KubePodNotRead
KubeDeploymentGenerationMismatch
KubeDeploymentReplicasMismatch
KubeStatefulSetReplicasMismatch
KubeStatefulSetGenerationMismatch
KubeStatefulSetUpdateNotRolledOut
KubeDaemonSetRolloutStuck
KubeContainerWaiting
KubeDaemonSetNotScheduled
KubeDaemonSetMisScheduled
KubeJobCompletion
KubeJobFailed
KubeHpaReplicasMismatch
KubeHpaMaxedOut
To learn more, see the upstream Kubernetes-Mixin’s Kubernetes Alert Runbooks page. You can update alerting rule links to point your own runbooks in these pre-configured alerts programmatically, using a tool like cortex-tools or grizzly. To learn more, see Prometheus and Loki rules with mimirtool and Alerts.
Recording Rules
Kubernetes Monitoring includes the following recording rules to speed up dashboard queries and alerting rule evaluation:
node_namespace_pod_container:container_cpu_usage_seconds_total:sum_irate
node_namespace_pod_container:container_memory_working_set_bytes
node_namespace_pod_container:container_memory_rss
node_namespace_pod_container:container_memory_cache
node_namespace_pod_container:container_memory_swap
cluster:namespace:pod_memory:active:kube_pod_container_resource_requests
namespace_memory:kube_pod_container_resource_requests:sum
cluster:namespace:pod_cpu:active:kube_pod_container_resource_requests
namespace_cpu:kube_pod_container_resource_requests:sum
cluster:namespace:pod_memory:active:kube_pod_container_resource_limits
namespace_memory:kube_pod_container_resource_limits:sum
cluster:namespace:pod_cpu:active:kube_pod_container_resource_limits
namespace_cpu:kube_pod_container_resource_limits:sum
namespace_workload_pod:kube_pod_owner:relabel
Note that recording rules may emit time series with the same metric name, but different labels.
To learn how to modify these programmatically, see Prometheus and Loki rules with mimirtool.
Logs
The default Kubernetes Monitoring setup instructions roll out a Grafana Agent DaemonSet to collect logs from all pods running in your cluster and ship these to Grafana Cloud Loki.
If you want to collect just logs, follow the Ship Kubernetes logs using Grafana Agent guide.
Traces
Kubernetes Monitoring does not yet support out-of-the-box configuration for shipping traces to your hosted Tempo endpoint. However, you can get started shipping traces to Grafana Cloud by following the Ship Kubernetes traces using Grafana Agent guide. This will roll out a single-replica Agent Deployment that will receive Traces and remote_write
these to Grafana Cloud.
How can I manage and track metrics and logs coming through Kubernetes Monitoring?
The best way to start controlling and managing your metrics is with the Reducing Kubernetes Metrics usage guide.
You can also analyze the distribution of your metrics and labels with cardinality management dashboards (included with Pro and Advanced) and analyze your current metrics usage and associated costs from the billing and usage dashboard located in your Grafana instance. These will help pinpoint unnecessary or duplicate metrics that may be coming from within your cluster. Another helpful resource is the Analyzing metrics usage with Grafana Explore guide. For logs, see the Explore for Logs guide.
Allowlists for managing metrics
Another method for managing metrics is to use allowlists. By default, Kubernetes Monitoring configures allowlists using Prometheus relabel_config blocks. To learn more about relabel_configs
, metric_relabel_configs
and write_relabel_configs
, see Reducing Prometheus metrics usage with relabeling.
These allowlists drop any metrics not referenced in the dashboards, rules, and alerts. To omit or modify the allowlists, modify the corresponding metric_relabel_configs
blocks in your Agent configuration. To learn more about analyzing and controlling active series usage, see Control Prometheus metrics usage.
Grafana Cloud billing is based on billable series. To learn more about the pricing model, see Active series and DPM.
Default active series usage varies depending on your Kubernetes cluster size (number of nodes) and running workloads (number of Pods, containers, Deployments, etc.).
When testing on a Cloud provider’s Kubernetes offering, the following active series usage was observed:
- 3 node cluster, 17 running pods, 31 running containers: 3.8k active series
- The only Pods deployed into the cluster were Grafana Agent and kube-state-metrics. The rest were running in the
kube-system
Namespace and managed by the cloud provider
- The only Pods deployed into the cluster were Grafana Agent and kube-state-metrics. The rest were running in the
- From this baseline, active series usage roughly increased by:
- 1000 active series per additional node
- 75 active series per additional pod (vanilla Nginx Pods were deployed into the cluster)
These are very rough guidelines and results may vary depending on your Cloud provider or Kubernetes version. Note also that these figures are based on the scrape targets configured above, and not additional targets like application metrics, API server metrics, and scheduler metrics.
I’m already sending kube-state-metrics to Prometheus - do I still need to use Grafana Agent?
You do not need to use Grafana Agent if you are already sending kube-state-metrics. Kubernetes Monitoring shows data in the Cluster navigation tab as long as you are using kube-state metrics version 2.1 or greater. However, some features (like pod logs, Kubernetes events, and resource management) rely on specific recording rules and metrics that ship with Grafana Agent, and may not show properly. To switch to Grafana agent, make sure to first remove the existing job that is sending metrics.
How can I migrate to Kubernetes Monitoring from an older integration?
If you are already sending kube-state-metrics to Grafana Cloud with Grafana Agent through the Kubernetes integration, no action is needed—Kubernetes Monitoring uses the existing metrics and you can start using the Kubernetes Monitoring preconfigured dashboards and alerting immediately.
If it has been a while since you deployed Grafana Agent into your cluster, you might want to redeploy by following the instructions in the Configuration section of Kubernetes Monitoring. See how to configure Kubernetes Monitoring using Grafana Agent.
Does Grafana Cloud support integrations on Kubernetes?
Grafana Cloud does not currently support integrations on Kubernetes as a platform, like the Linux Node integration (node-exporter), Redis integration, MySQL integration, and others. Until this support is available, use embedded Agent exporters and integrations by configuring them manually. To learn how, see integrations_config.
Node-exporter metrics
For node-exporter or host system metrics, you can roll out the node-exporter Helm Chart and add the following Agent scrape config job:
. . .
- bearer_token_file: /var/run/secrets/kubernetes.io/serviceaccount/token
job_name: integrations/node-exporter
kubernetes_sd_configs:
- namespaces:
names:
- NODE_EXPORTER_NAMESPACE_HERE
role: pod
relabel_configs:
- action: keep
regex: prometheus-node-exporter.*
source_labels:
- __meta_kubernetes_pod_label_app
- action: replace
source_labels:
- __meta_kubernetes_pod_node_name
target_label: instance
- action: replace
source_labels:
- __meta_kubernetes_namespace
target_label: namespace
tls_config:
ca_file: /var/run/secrets/kubernetes.io/serviceaccount/ca.crt
insecure_skip_verify: false
This will instruct Agent to scrape any Pod with the label app=prometheus-node-exporter.*
(the value is a regular expression). The Helm chart configures this label by default, but if you modify the Chart’s values.yaml
file or any other set defaults, you may have to adjust this scrape job accordingly. To learn more, see this set of examples.
Can I correlate data across metrics, logs, and traces?
Prometheus and Grafana Loki’s shared metadata keeps the same labels for your Kubernetes cluster, so you can access correlated Kubernetes metrics and logs.
Documentation for configuring correlation across metrics, logs and traces, specifically for Kubernetes workloads is forthcoming. In the interim period, see Intro to monitoring Kubernetes with Grafana Cloud. Note that this video was published prior to the release of Kubernetes Monitoring, so some concepts may differ slightly.
Can I monitor Kubernetes events?
Kubernetes events provide helpful logging information emitted by K8s cluster controllers. Grafana Agent contains an embedded integration that watches for event objects in your clusters, and ships them to Grafana Cloud for long-term storage and analysis. To enable this beta feature, see the Set up Kubernetes event monitoring guide. The setup instructions enable this feature by default in the Grafana Agent StatefulSet.
Where can I get help with installing Grafana Agent Operator?
If you need help installing Grafana Agent Operator, open a Support ticket by visiting your Grafana Cloud Portal and clicking Open a Support Ticket.
Where can I get help with the Kubernetes Monitoring?
You can open a Support ticket by visiting your Grafana Cloud Portal and clicking Open a Support Ticket.