Explore entity details
Entity details include pre-filtered views of logs, traces, Kubernetes metrics, continuous profiling data, and entity properties. The knowledge graph automatically correlates all telemetry to the selected entity, eliminating the need to write custom queries.
Logs
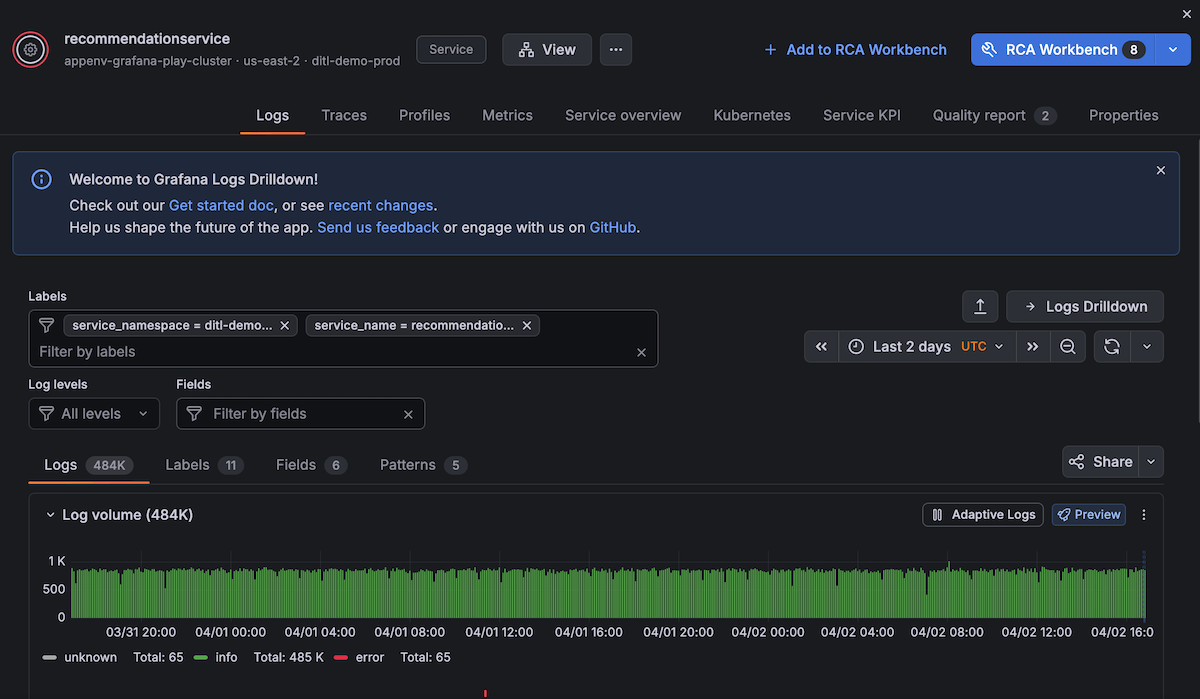
The Logs tab provides instant access to all log events from the selected entity, pre-filtered to the current time range.
What you’ll see
- Log stream showing recent log entries
- Severity distribution (info, warning, error)
- Time alignment matching the service overview time range
- Automatic filters applied for the entity’s labels
Use logs for troubleshooting
Logs are especially valuable for:
- Error investigation - Find stack traces and error messages during incidents
- Deployment verification - Check startup messages after deployments
- Pattern discovery - Identify repeated warnings or unusual log patterns
The log view supports:
- Full-text search to find specific messages
- Severity filtering to focus on errors or warnings
- Time range adjustment to narrow or expand the window
- Log context - Click any log line to see surrounding entries
Logs automatically sync with the time range selected in the service overview, allowing you to correlate log events with metric anomalies.
Access Logs Drilldown
For deeper log exploration, click → Logs Drilldown to open the full Logs Drilldown experience. The Drilldown view automatically filters to the selected entity and provides advanced capabilities:
- Find and filter logs by labels, fields, and patterns
- Drill into data using volume and text patterns
- Uncover related logs and monitor changes over time
- Interact with formatted log data
You can accomplish these tasks without writing any LogQL queries.
Traces
The Traces tab shows distributed trace data for requests handled by the entity.
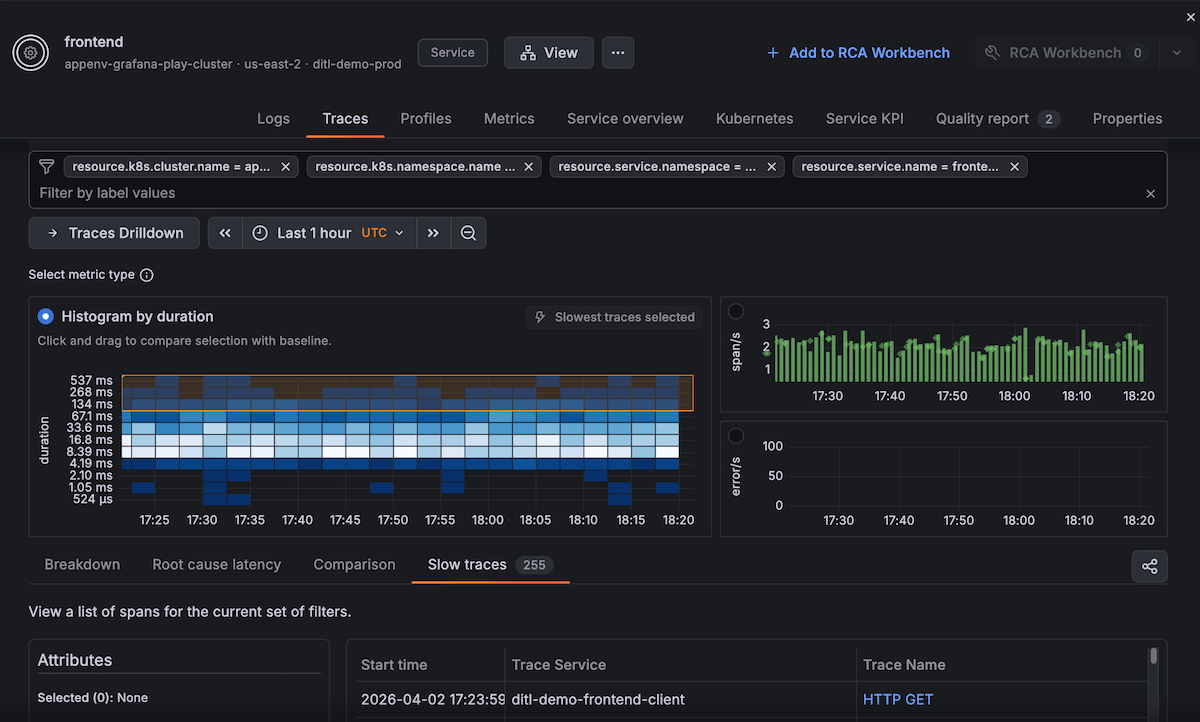
Duration heatmap
The primary visualization is a duration heatmap showing:
- Request distribution over time (x-axis)
- Duration buckets from fast to slow (y-axis)
- Color intensity indicating request volume in each bucket
This allows you to spot:
- Latency spikes appearing as vertical bands in slower buckets
- Bimodal patterns when some requests are fast, others slow
- Degradation over time with requests gradually moving to slower buckets
Trace analysis
Below the heatmap, you’ll find:
- Sample traces from the selected time range
- Duration statistics (P50, P95, P99)
- Error rate for traced requests
- Operation breakdown showing which endpoints are slowest
Click any trace to open the full trace timeline with:
- All service hops and their durations
- Database queries and external API calls
- Error annotations and log correlation
When traces are most useful
Use the Traces tab to:
- Diagnose slow requests by examining trace timelines
- Identify downstream bottlenecks from service call durations
- Correlate errors between services in the request path
- Validate optimizations by comparing trace patterns before and after changes
Access Traces Drilldown
For deeper trace exploration, click → Traces Drilldown to open the full Traces Drilldown experience. The Drilldown view automatically filters to the selected entity and provides advanced capabilities:
- Analyze error rates and latency patterns over time
- Break down traces by attributes (service version, endpoint, operation)
- Compare performance across different dimensions
- View exceptions and traces with errors
- Navigate root cause errors with insights correlation
You can explore trace data without writing any TraceQL queries.
Profiles
The Profiles tab provides access to continuous profiling data, showing where your application spends CPU time and allocates memory.
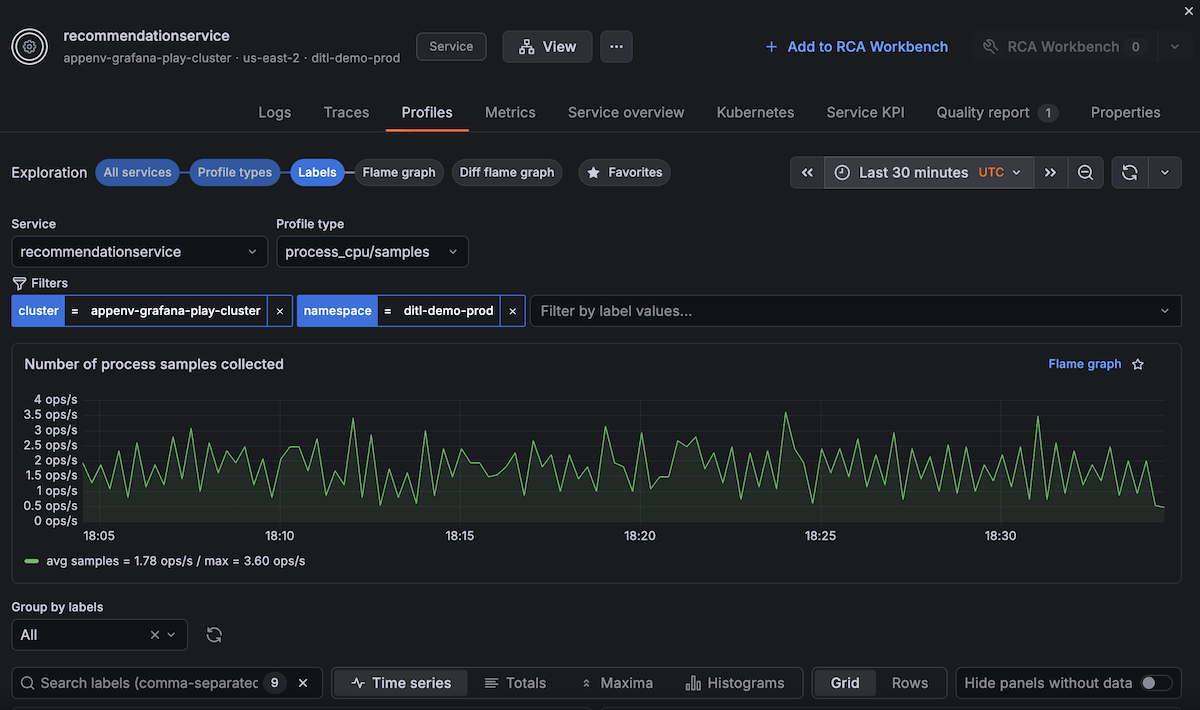
CPU profiles
The CPU flame graph shows:
- Function call hierarchy with time spent in each function
- Hot paths highlighting expensive code sections
- Over time comparison to detect performance regressions
Use CPU profiles to:
- Identify inefficient algorithms or loops
- Find unexpected library overhead
- Validate performance optimizations
Memory profiles
Memory allocation profiles show:
- Allocation sites and their frequency
- Memory leak detection with growing allocations
- Garbage collection impact from excessive allocations
Memory profiles help answer:
- Where is memory being allocated?
- Are there memory leaks over time?
- Can we reduce allocation pressure?
Profile availability
Continuous profiling requires:
- Grafana Pyroscope integration enabled
- Application instrumented for profiling (automatic for supported languages)
- Profile data being sent to Grafana Cloud
If profiles aren’t available, the tab shows setup instructions.
Metrics
The Metrics tab provides access to all metrics associated with the entity, automatically filtered to show only relevant time series data.
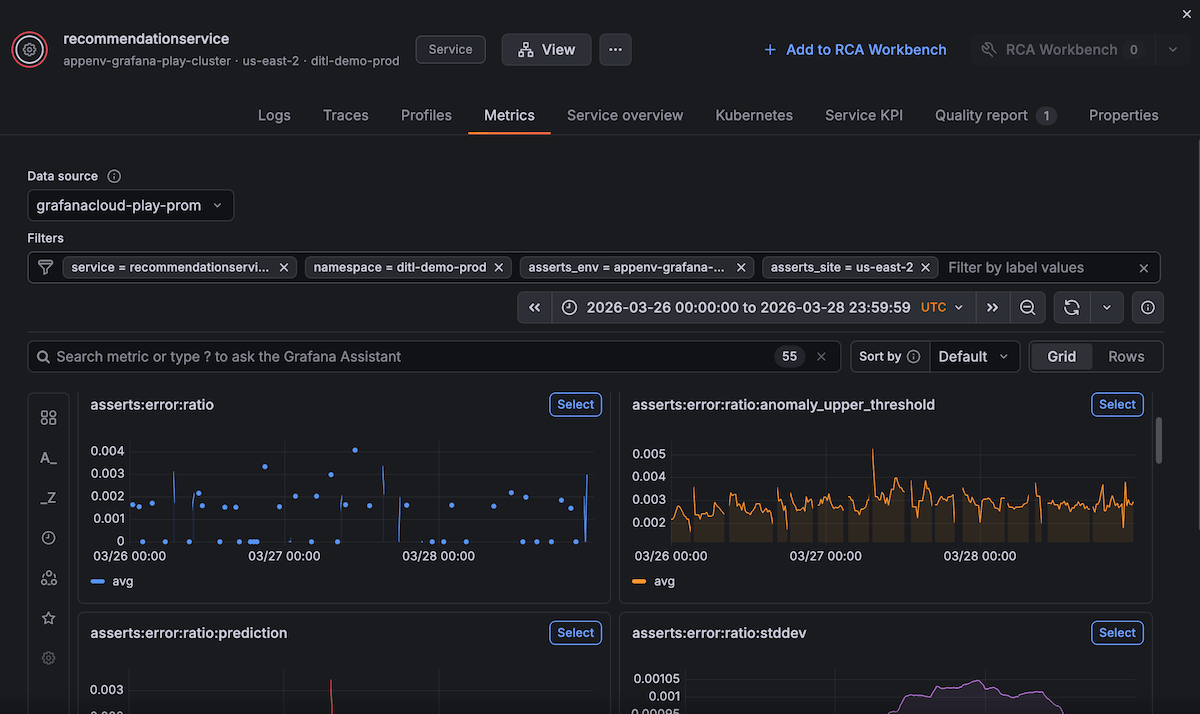
What you’ll see
- Pre-filtered metrics - All metrics automatically scoped to the entity’s labels (service, namespace, environment)
- Metric browser - Grid or row view of time series charts
- Search capabilities - Find specific metrics by name or use the Grafana Assistant
- Data source selector - Choose which Prometheus-compatible data source to query
- Metric count - Total number of available metrics for the entity
The Metrics tab displays entity-specific metrics including:
- Application metrics - Request rates, error rates, latency percentiles
- Custom metrics - Any application-specific metrics your service emits
- Insight metrics - Thresholds, predictions, and anomaly detection values used by the knowledge graph
- Infrastructure metrics - Resource utilization scoped to the entity
Explore metrics
Each metric panel shows:
- Time series visualization - Historical values over the selected time range
- Metric name - Full metric identifier
- Select button - Add metric to further analysis or dashboards
- Average values - Summary statistics for quick assessment
Use the Metrics tab to:
- Investigate metric patterns during incidents or performance issues
- Compare metric values across different time ranges
- Identify unusual metric behavior that might indicate problems
- Validate hypotheses by examining raw metric data
- Find related metrics by browsing what’s available for the entity
The time range automatically syncs with the service overview, allowing you to correlate metric behavior with insights and other telemetry signals.
Kubernetes metrics
For services running on Kubernetes, the Kubernetes metrics tab shows infrastructure health.
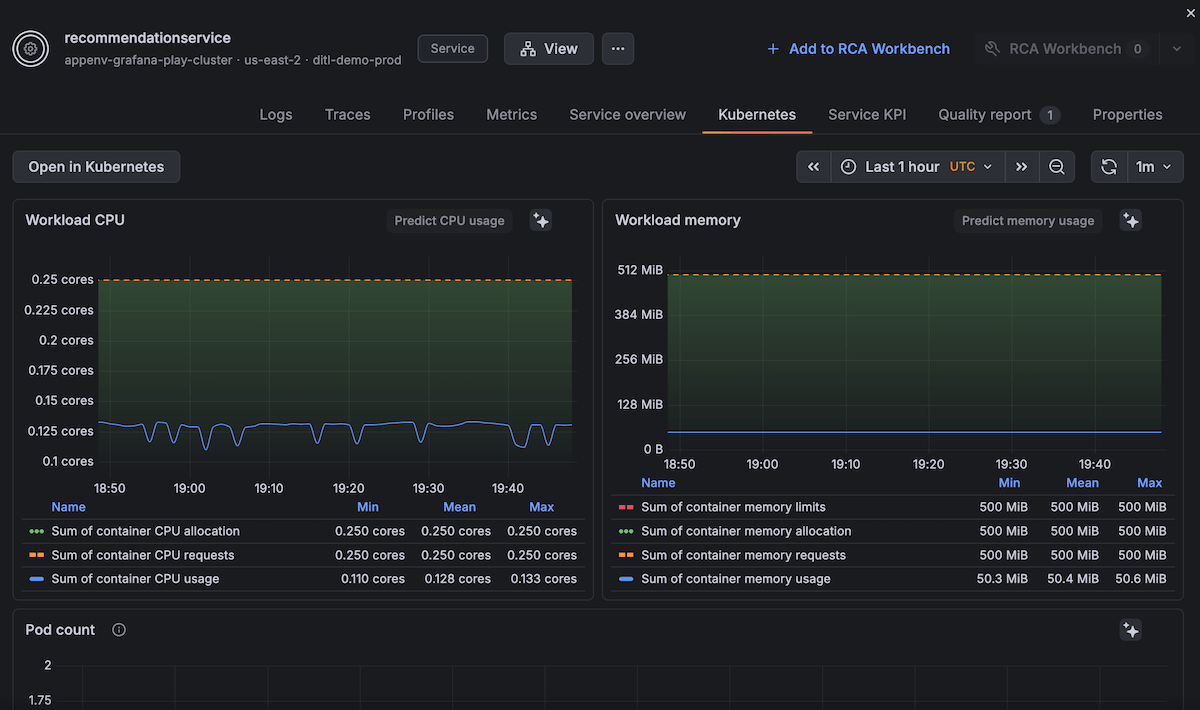
Pod metrics
- CPU usage - Current and historical CPU consumption
- Memory usage - Current memory with limits and requests
- Network I/O - Bytes sent and received
- Restart count - How many times pods have restarted
Node metrics
If viewing a node entity, you’ll see:
- Node capacity - Total CPU and memory available
- Pod count - Number of pods scheduled on the node
- Disk usage - Available and used disk space
- Network throughput - Node-level traffic
Resource saturation indicators
The Kubernetes metrics tab highlights:
- CPU throttling when pods exceed their limits
- Memory pressure approaching OOM conditions
- Disk saturation nearing capacity
- Network bottlenecks with high packet loss
These metrics help answer questions like:
- Is the service resource-constrained?
- Should we increase CPU or memory limits?
- Are pods restarting due to OOM kills?
- Is the node saturated?
Properties
The Properties tab displays all metadata and discovery information for the entity.
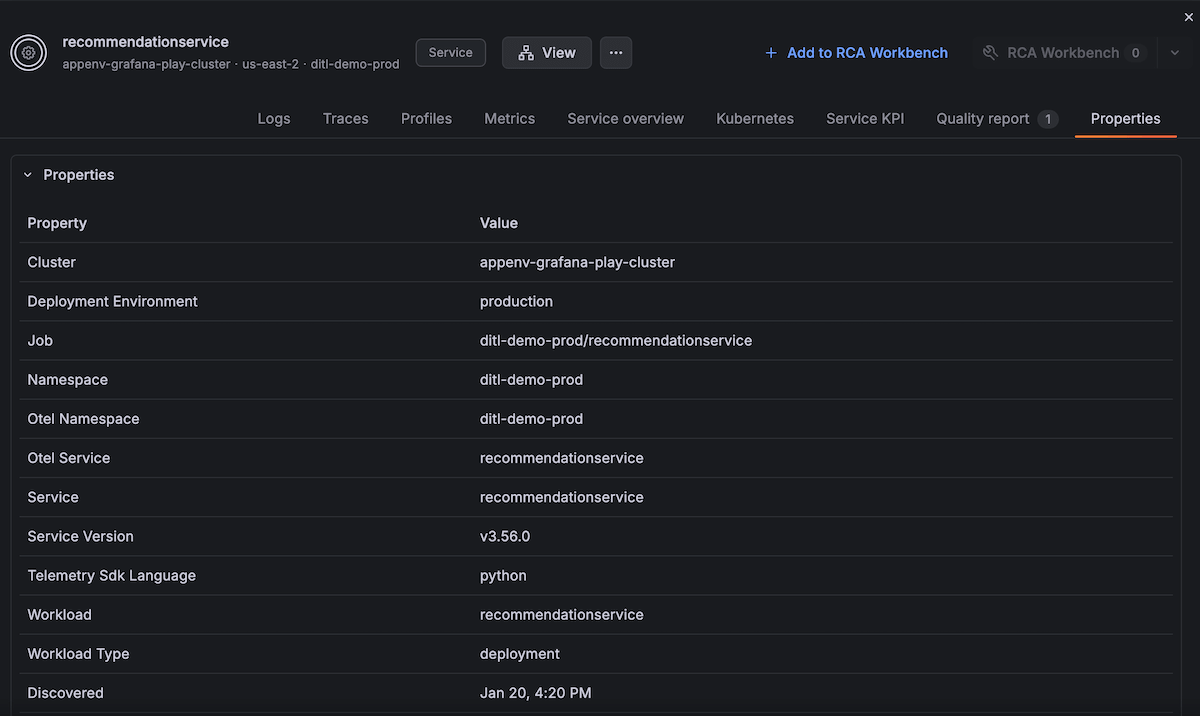
Entity metadata
- Entity type - Service, Pod, Node, Database, and so on.
- Cluster and Namespace (for Kubernetes entities)
- Labels - All key-value labels attached to the entity
- Annotations - Additional metadata from discovery sources
Discovery information
- Data source - How the entity was discovered (OpenTelemetry, Istio, Prometheus exporters)
- First seen - When the entity first appeared
- Last updated - Most recent telemetry timestamp
- Related entities - Connections to other entities in the graph
Custom properties
Any custom labels or properties you’ve added appear here, allowing you to:
- Filter the entity catalog by team, environment, or version
- Group entities for monitoring views
- Track deployment metadata
Add entities to RCA workbench
From any tab in the entity details, you can add the entity to RCA workbench for multi-entity investigation.
Click Add to RCA workbench to:
- Include this entity in your current RCA workbench session
- See its insights correlated with other entities on a timeline
- Navigate between related entities in the incident context
This is especially useful when:
- An issue spans multiple services
- You need to correlate infrastructure and application problems
- You want to see which issues started at the same time
For more information, refer to Use RCA workbench.
Next steps
- View service overview - Understand RED metrics and thresholds
- Use RCA workbench - Correlate insights across multiple entities
- Navigate the entity graph - Visualize dependencies


