Menu
Documentation Grafana Cloud
Knowledge graph
Advanced configuration
Enable metrics collection
Run times
NodeJS
Grafana Cloud
Knowledge graph
Advanced configuration
Enable metrics collection
Run times
NodeJS
Grafana Cloud
Configure NodeJS to generate Prometheus metrics
To configure NodeJS to generate Prometheus metrics, refer to Prometheus NodeJS Exporter.
Metrics and KPIs
Dashboard
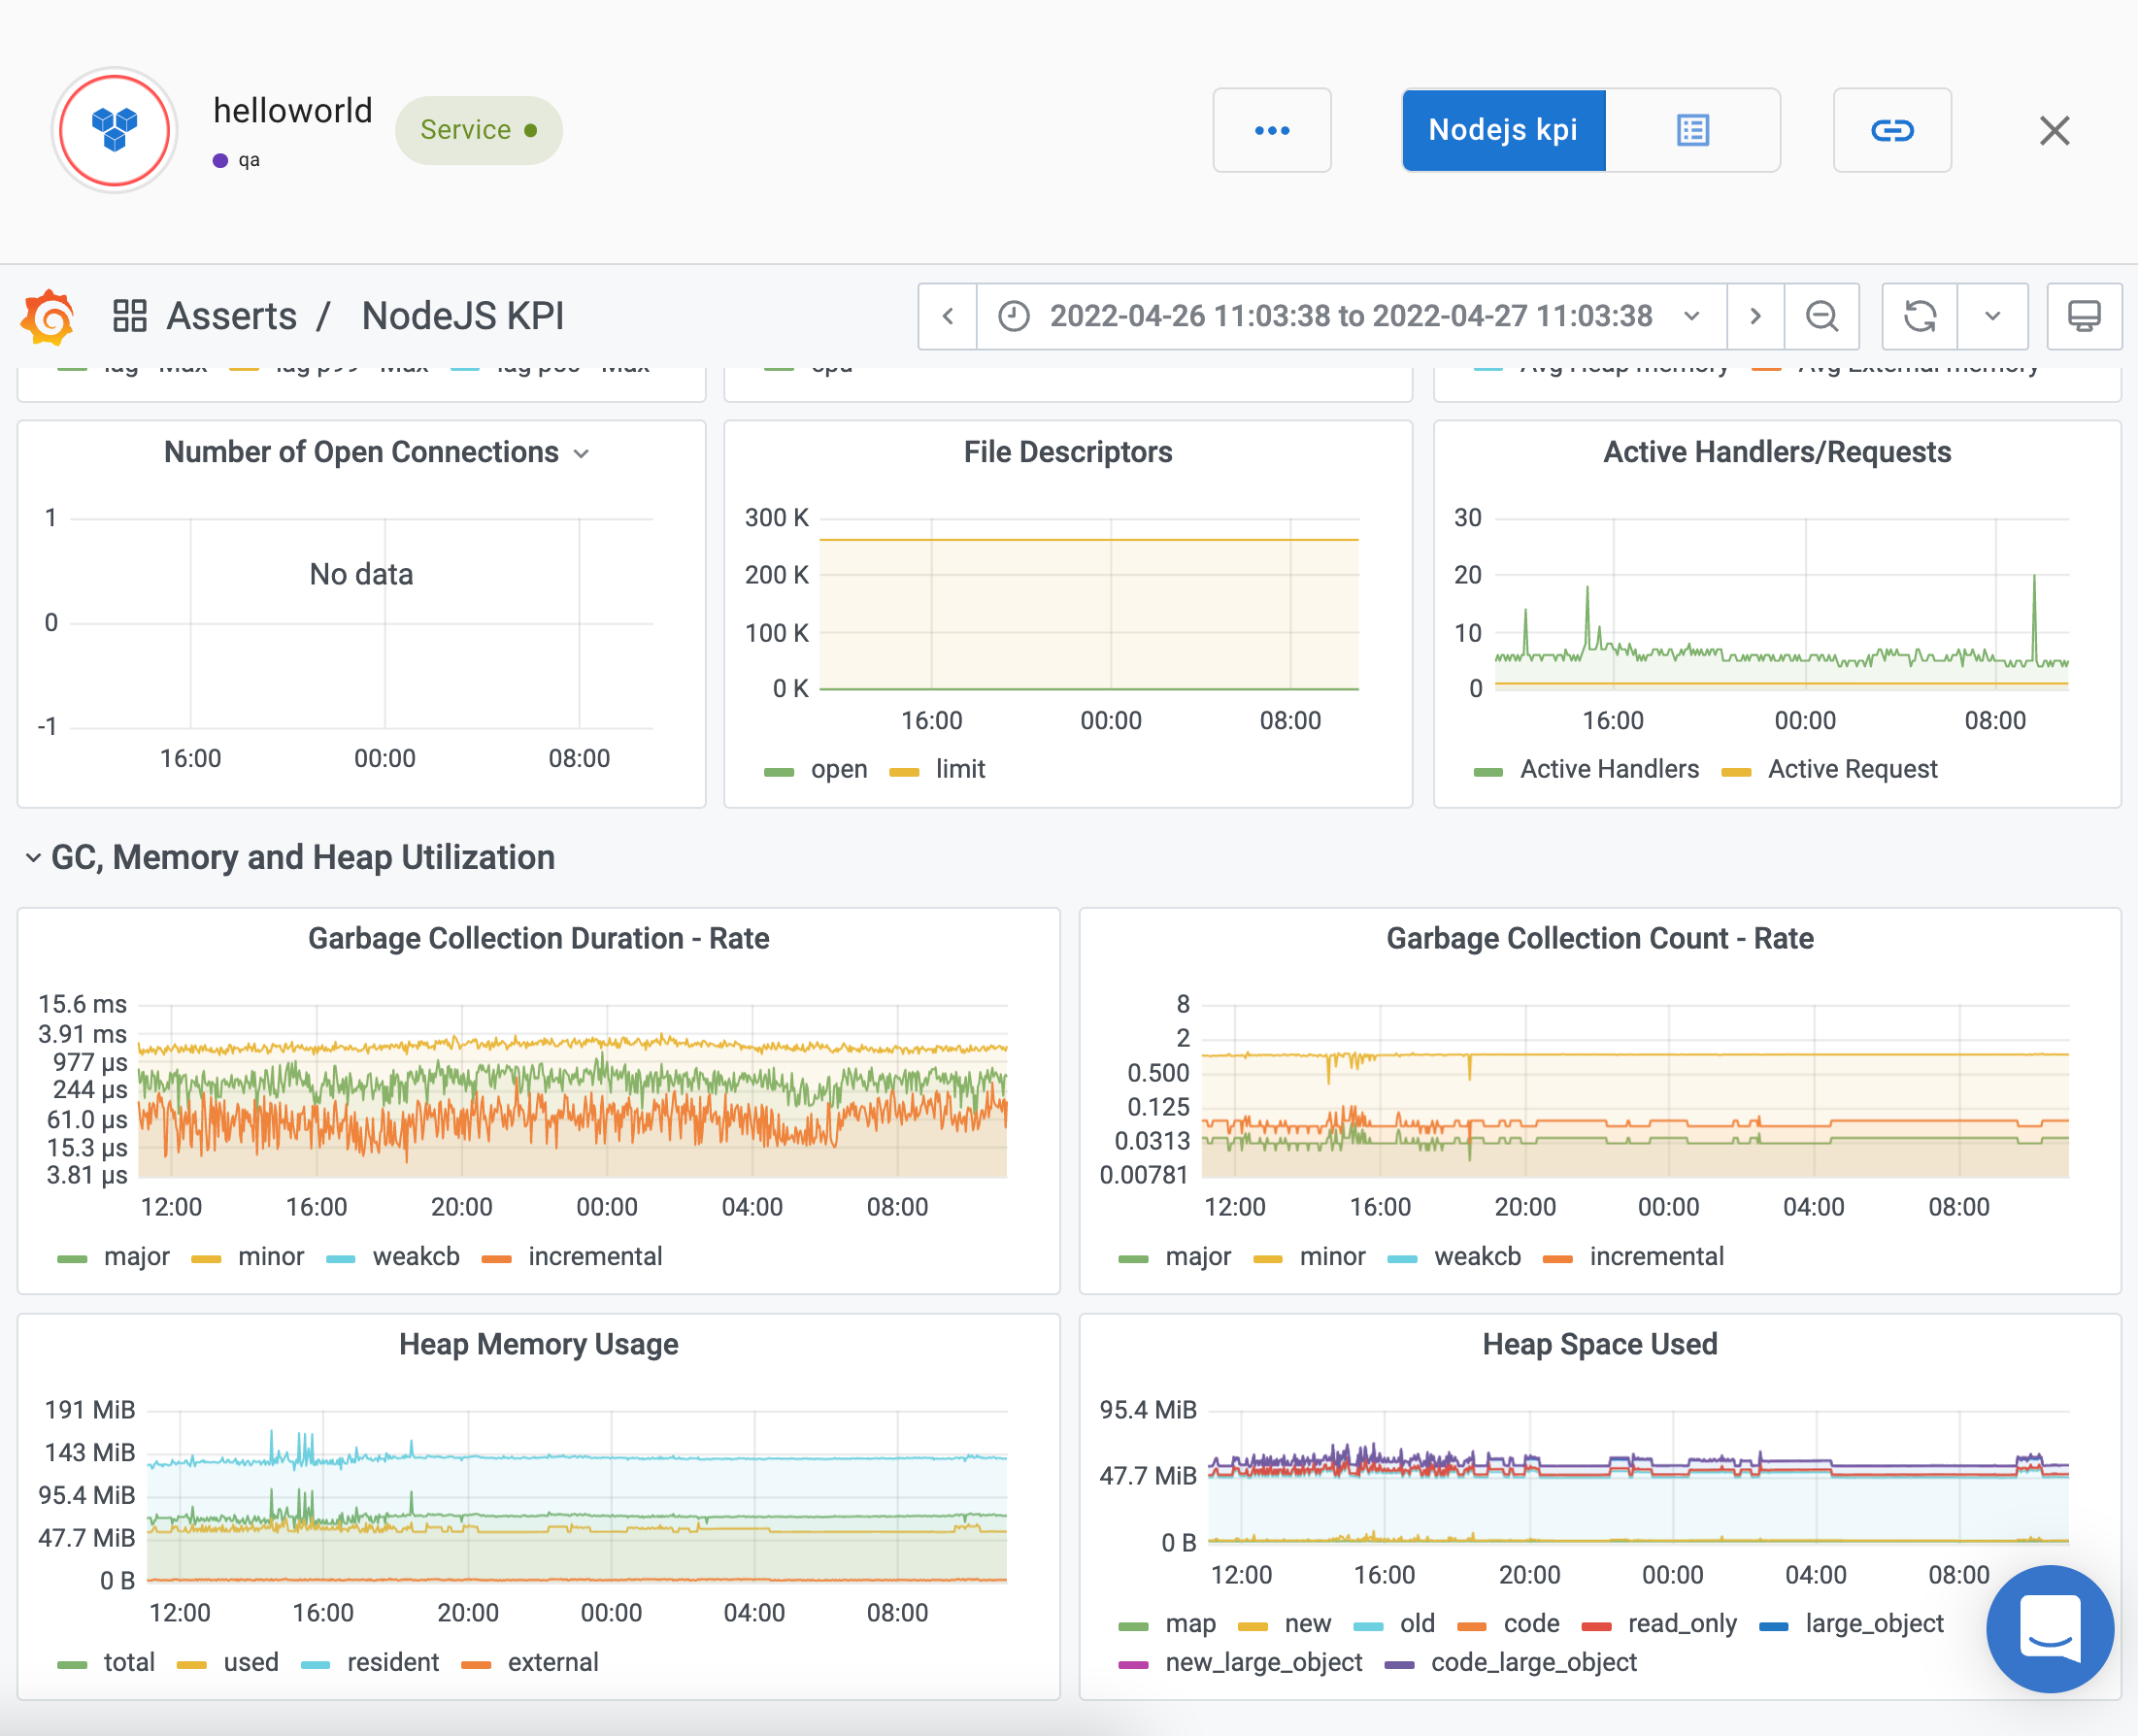
In addition to these KPIs, the KPI dashboard includes the following NodeJS runtime metrics.
Heap usage
- nodejs_heap_size_total_bytes
- nodejs_heap_size_used_bytes
- nodejs_heap_space_size_used_bytes
Event loop latency
- nodejs_eventloop_lag_seconds
- nodejs_eventloop_lag_p99_seconds
GC duration and count
- rate(nodejs_gc_duration_seconds_sum[5m])
- rate(nodejs_gc_duration_seconds_count[5m])
Active handles and requests
- nodejs_active_handles_total
- nodejs_active_reqeuests_total
File handles
- process_open_fds
- process_max_fds