Menu
Documentation Grafana Cloud
Knowledge graph
Advanced configuration
Enable metrics collection
Run times
Java
Grafana Cloud
Knowledge graph
Advanced configuration
Enable metrics collection
Run times
Java
Grafana Cloud
Configure Java to generate Prometheus metrics
Use one of the following options to configure Java to generate Prometheus metrics:
- Install JMX Exporter
- (Recommended) Install Micrometer Prometheus Exporter. The Micrometer exporter provides more information.
Metrics and KPIs
Alerts
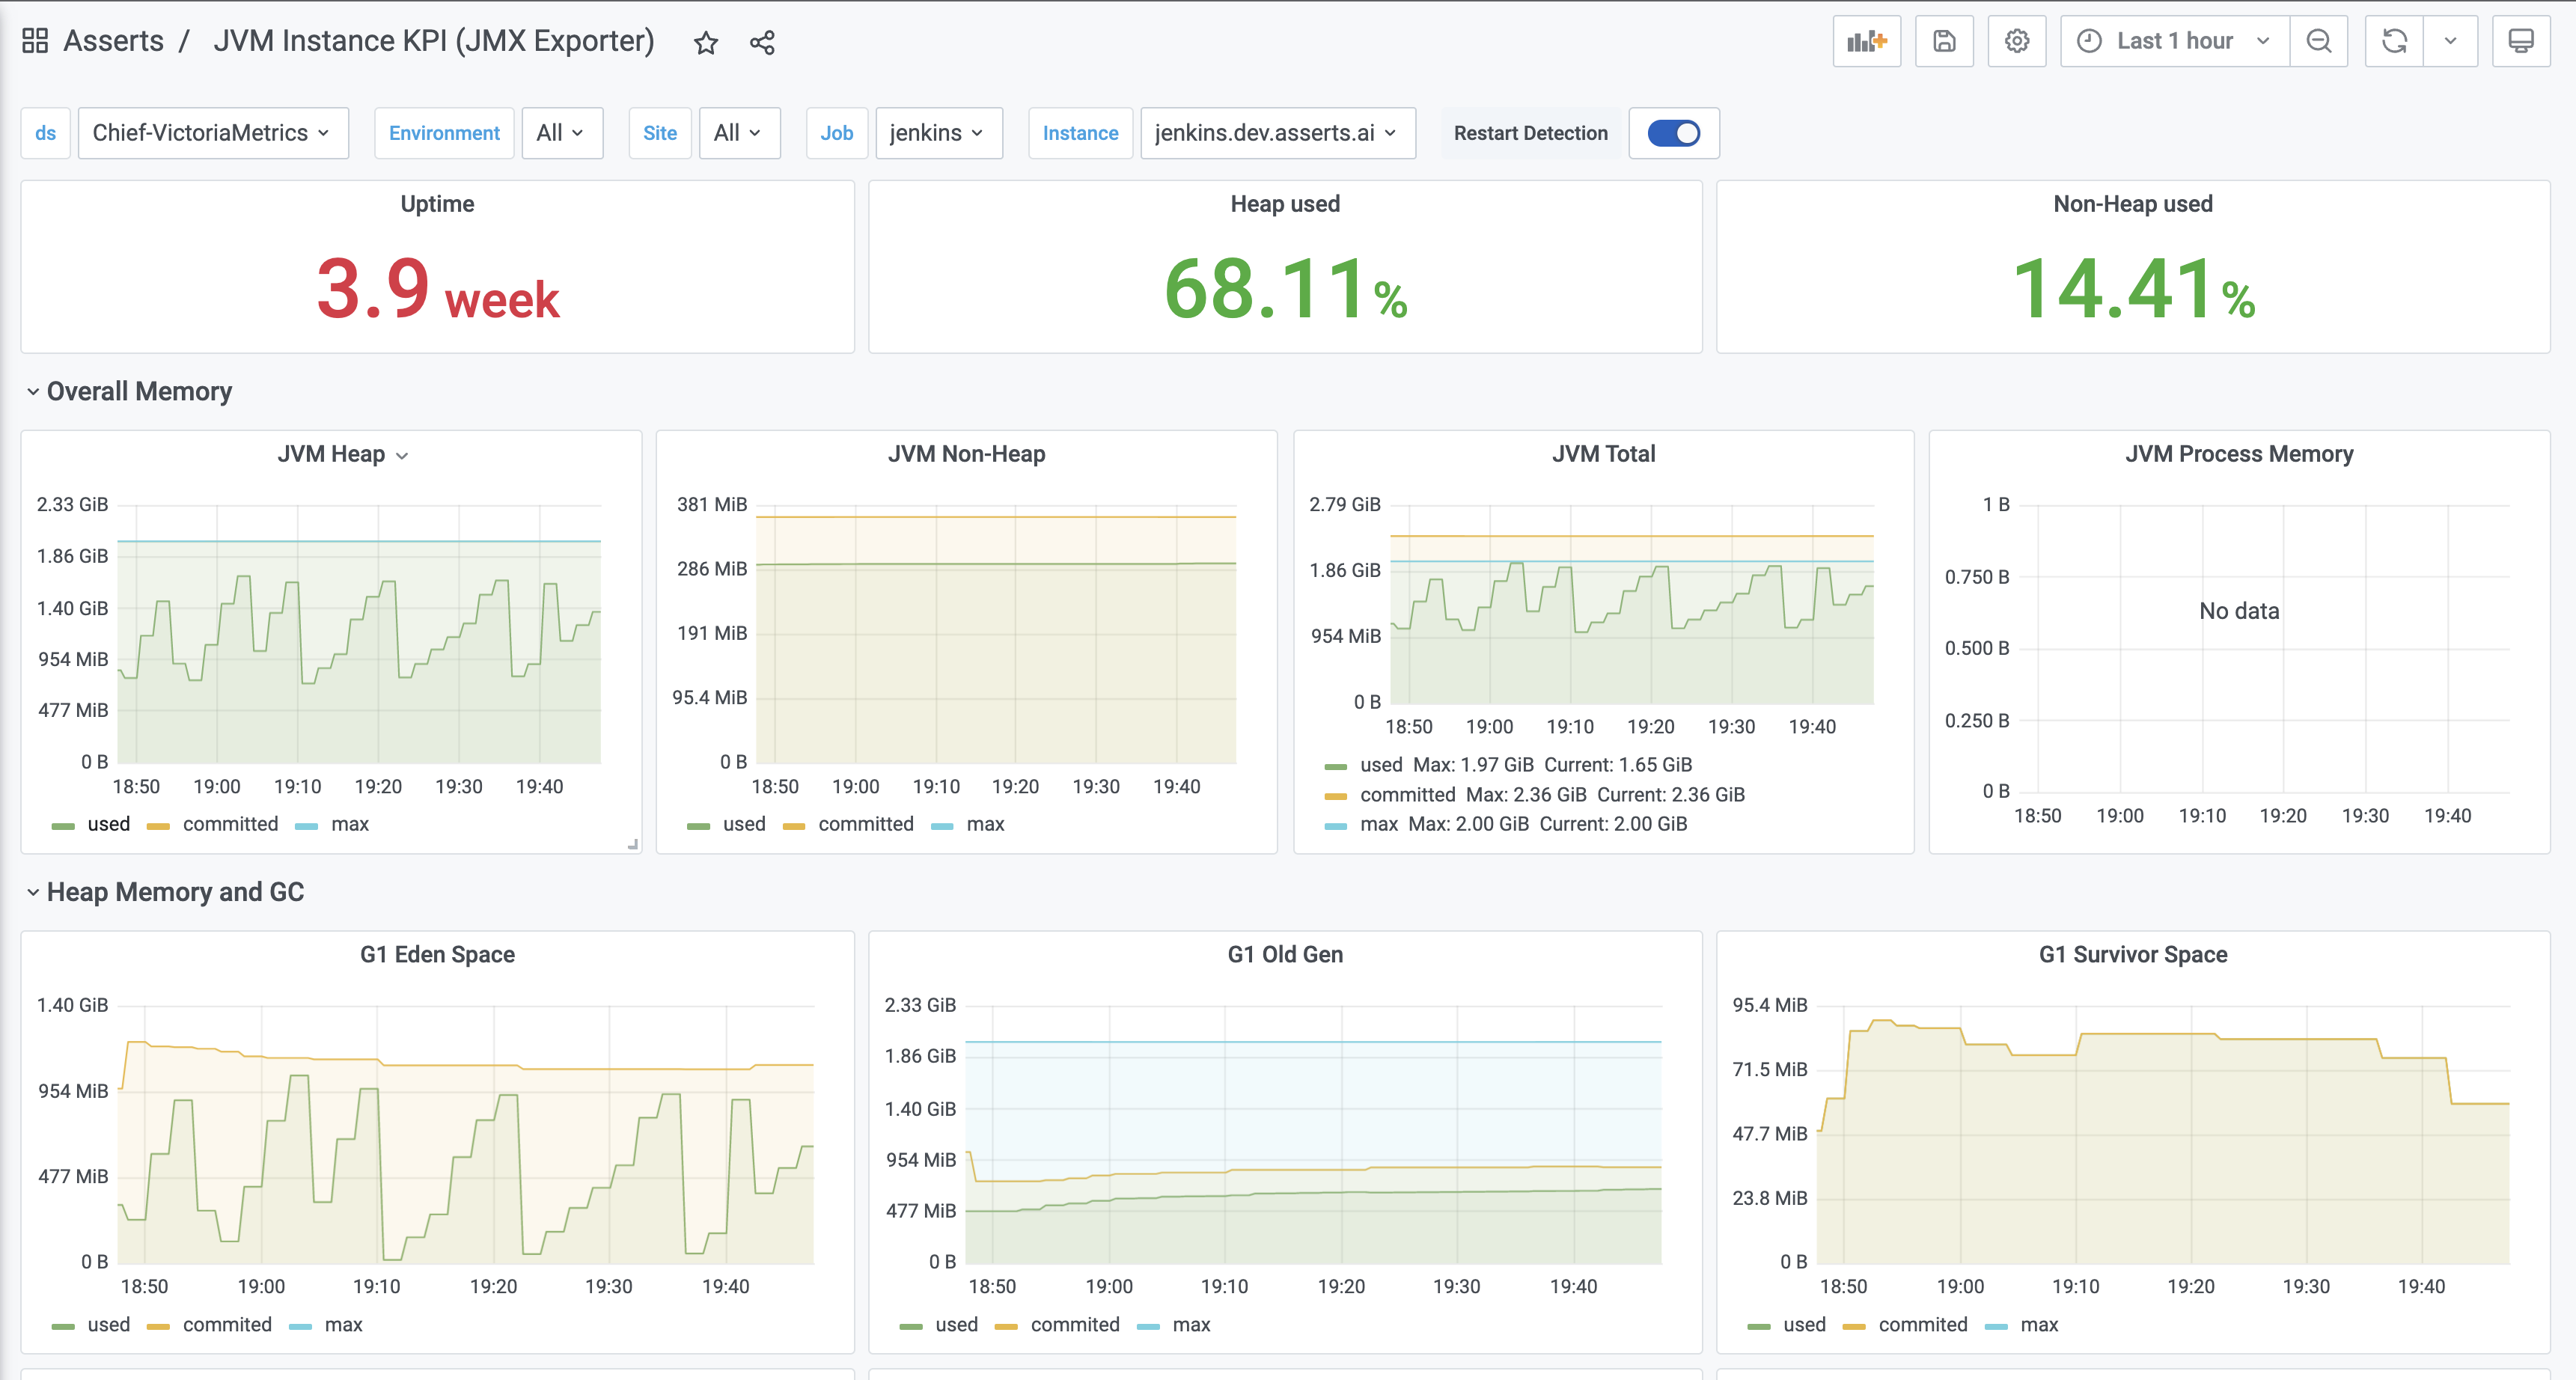
Dashboard
The JVM instance KPI dashboard includes metrics for CPU, heap memory, non-heap memory, buffer pools, threads, file descriptors, and classes loaded.
CPU
- system_cpu_usage
- process_cpu_usage
- system_cpu_count
- system_load_average_1m
Heap memory
The following heap metrics are available for Eden Space, Survivor Space, and Tenured Generation.
- jvm_memory_used_bytes{area=“heap”}
- jvm_memory_committed_bytes{area=“heap”}
- jvm_memory_max_bytes{area=“heap”}
Non-heap memory
The following non-heap metrics are available for Metaspace, Compressed Class Space, and Code Cache.
- jvm_memory_used_bytes{area=“nonheap”}
- jvm_memory_committed_bytes{area=“nonheap”}
- jvm_memory_max_bytes{area=“nonheap”}
Buffer pools
The following metrics are available for Direct and Mapped buffers.
- jvm_buffer_total_capacity_bytes
- jvm_buffer_memory_used_bytes
- jvm_buffer_count_buffers
Threads
- jvm_threads_live_threads
- jvm_threads_daemon_threads
- jvm_threads_peak_threads
- process_threads
- jvm_threads_states_threads
File descriptors
- process_files_open_files
- process_files_max_files
Classes loaded
- jvm_classes_loaded_classes