Documentation for automated readers
A curated documentation index is available at: https://grafana.com/llms.txt
A complete documentation index is available at: https://grafana.com/llms-full.txt
These indexes can help with page discovery before fetching individual documents.
This page is also available in Markdown, which may be easier for automated readers and AI tools to parse than HTML. The Markdown version is available at https://grafana.com/docs/grafana-cloud/knowledge-graph/advanced-configuration/enable-prom-metrics-collection/application-frameworks/loopback.md, or by sending Accept: text/markdown to https://grafana.com/docs/grafana-cloud/knowledge-graph/advanced-configuration/enable-prom-metrics-collection/application-frameworks/loopback/. For broader documentation discovery, the curated index is available at https://grafana.com/llms.txt and the complete index is available at https://grafana.com/llms-full.txt.
Configure Loopback to generate Prometheus metrics
To configure Loopback to generate Prometheus metrics, complete the following steps:
Run the following commands:
Install -------- npm install --save @loopback/metrics Import -------- import {MetricsComponent} from '@loopback/metrics';In the constructor, add the following component to your application:
this.component(MetricsComponent);For more information about additional configuration changes, refer to loopback-metrics.
Verify the presence of the following metrics in Prometheus:
- loopback_invocation_total
- loopback_invocation_duration_seconds
Metrics
| Metric | KPI |
|---|---|
Requests loopback_invocation_total | Request Rate rate(loopback_invocation_total[5m]) |
Errors loopback_invocation_total | Error Ratio (server errors) rate(loopback_invocation_total{status= Error Ratio (client errors) rate(loopback_invocation_total{statusCode=“4..”}[5m])/ rate(loopback_invocation_total[5m]) |
Latency loopback_invocation_duration_seconds | Latency Average rate(loopback_invocation_duration_seconds[5m])/ rate(loopback_invocation_total[5m]) Latency P99 histogram_quantile ( |
Alerts
| KPI | Alerts |
|---|---|
| Request Rate | RequestRateAnomaly |
| Error Rate | ErrorRatioBreach ErrorBuildup based on a 99.9 SLO |
Latency Average Latency P99 | LatencyAverageBreach LatencyAverageAnomaly LatencyP99ErrorBuildup |
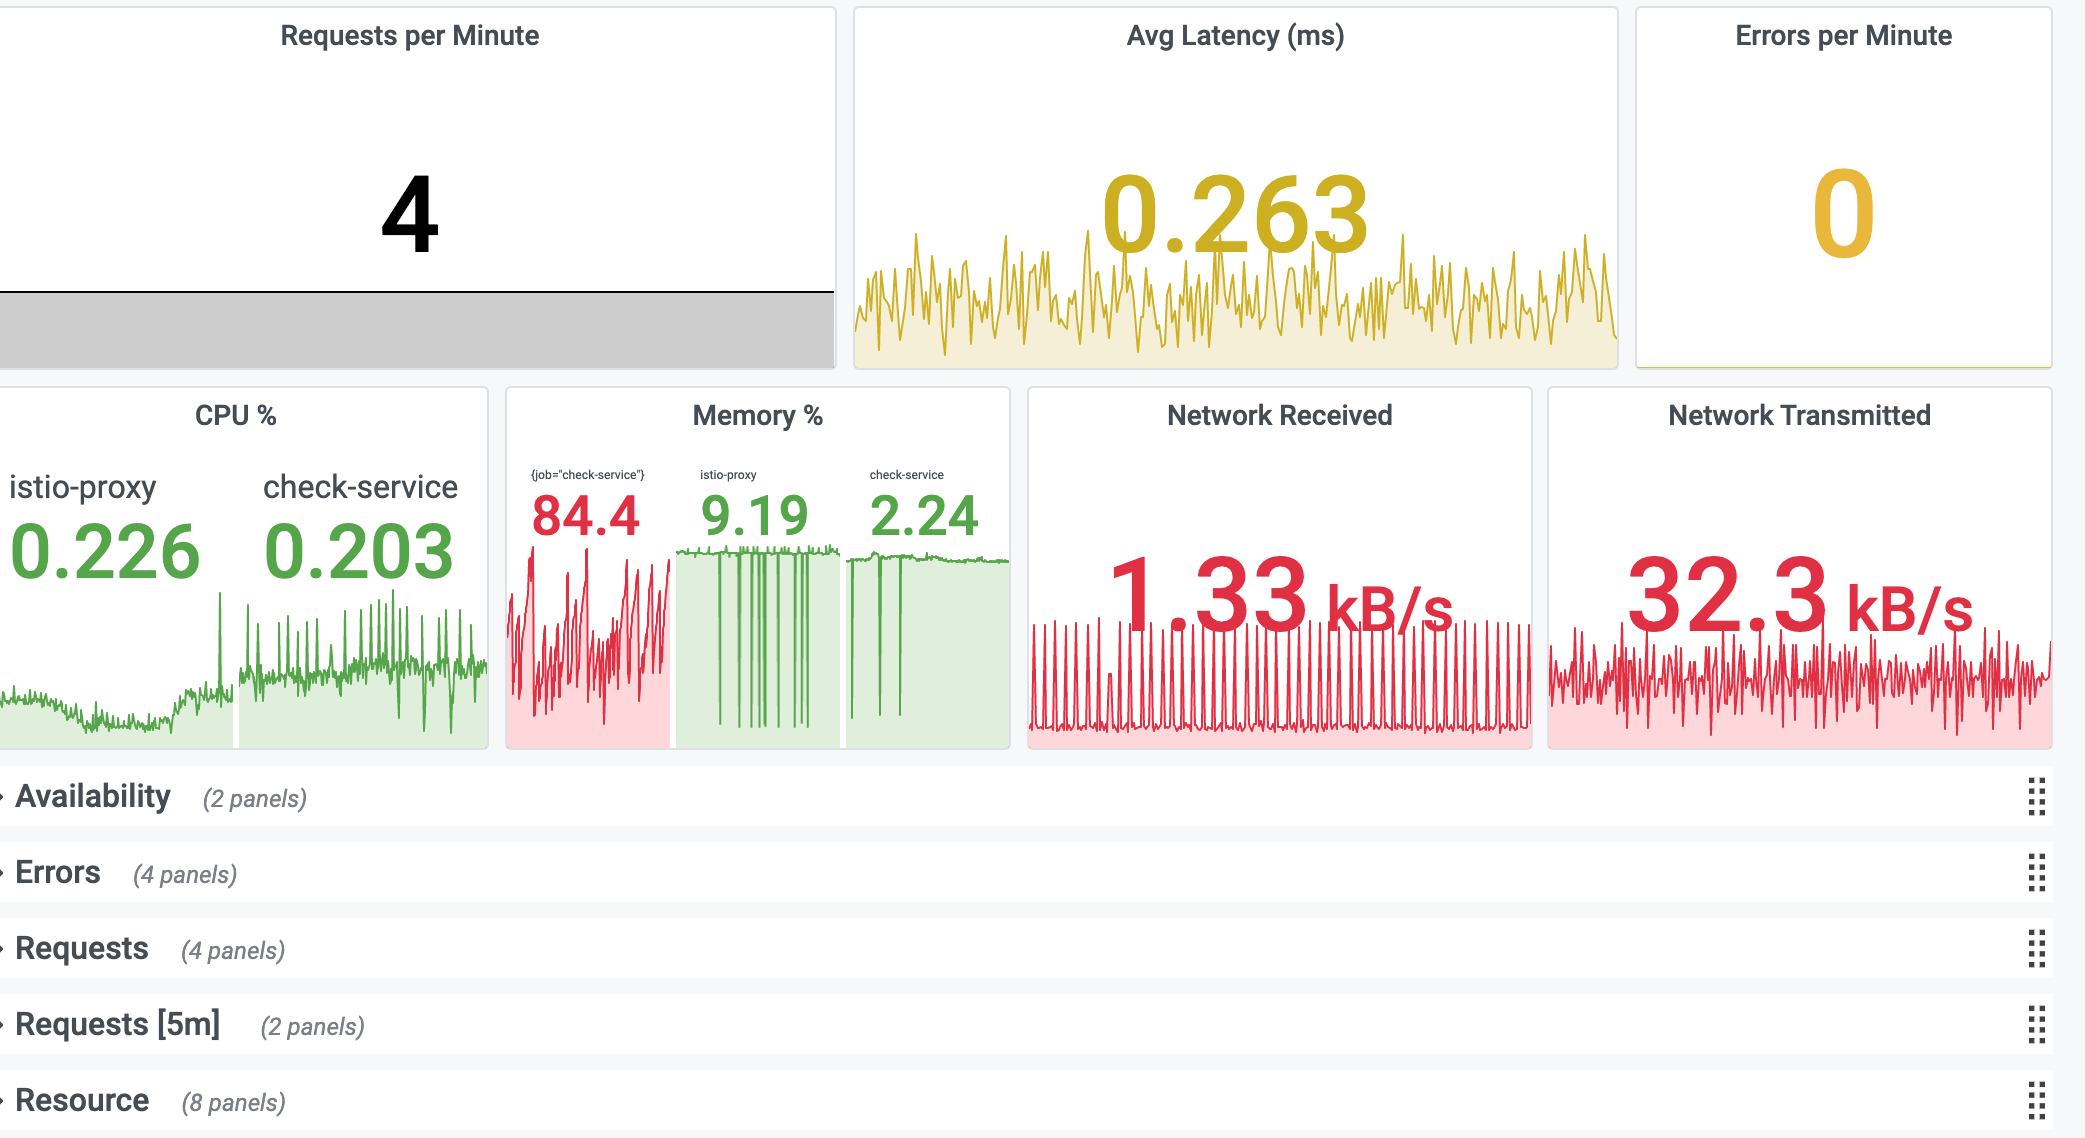
Service KPI dashboard
This dashboard has the following KPIs from resources and requests:
- Request Rate
- Latency Average
- Latency P99
- Error Rate
- CPU %
- CPU Cores Used
- CPU Throttle
- Memory %
- Memory Bytes
- Disk Usage
- Network Usage

Was this page helpful?
Related resources from Grafana Labs


