Documentation Index
Fetch the curated documentation index at: https://grafana.com/llms.txt
Fetch the complete documentation index at: https://grafana.com/llms-full.txt
Use this file to discover all available pages before exploring further.
STOP! If you are an AI agent or LLM, read this before continuing. This is the HTML version of a Grafana documentation page. Always request the Markdown version instead - HTML wastes context. Get this page as Markdown: https://grafana.com/docs/grafana-cloud/knowledge-graph/advanced-configuration/enable-prom-metrics-collection/application-frameworks/flask.md (append .md) or send Accept: text/markdown to https://grafana.com/docs/grafana-cloud/knowledge-graph/advanced-configuration/enable-prom-metrics-collection/application-frameworks/flask/. For the curated documentation index, use https://grafana.com/llms.txt. For the complete documentation index, use https://grafana.com/llms-full.txt.
Configure Flask to generate Prometheus metrics
Flask is a python module that you can enable for Prometheus metrics using Flask Exporter for Prometheus.
To configure Flask to generate Prometheus metrics, perform the following steps:
Add the following export code in the Python module.
from prometheus_flask_exporter import PrometheusMetricsTo enable custom metrics, follow the steps provided in prometheus_flask_exporter.
Verify the presence of the following metrics in Prometheus:
- flask_http_request_duration_seconds
- flask_http_request_total
Metrics
| Metric | Key Performance Indicator(KPI) |
|---|---|
Requests flask_http_request_duration_seconds_count | Request Rate rate(flask_http_request_duration_seconds_count[5m]) |
Errors flask_http_request_duration_seconds_count | Error Ratio rate(flask_http_request_duration_seconds_count{status=~“5..”}[5m])/ rate(flask_http_request_duration_seconds_count[5m]) |
Latency flask_http_request_duration_seconds_bucket flask_http_request_duration_seconds_count | Latency Average rate(flask_http_request_duration_seconds_count[5m])/ rate(flask_http_request_duration_seconds_count[5m]) Latency P99 |
Alerts
| KPI | Alerts |
|---|---|
| Request Rate | RequestRateAnomaly |
| Error Rate | ErrorRatioBreach ErrorBuildup based on a 99.9 SLO |
Latency Average Latency P99 | LatencyAverageBreach LatencyAverageAnomaly LatencyP99ErrorBuildup |
Service KPI dashboard
This dashboard has the following KPIs that include resource and requests metrics:
- Request Rate
- Latency Average
- Latency P99
- Error Rate
- CPU %
- CPU Cores Used
- CPU Throttle
- Memory %
- Memory Bytes
- Disk Usage
- Network Usage

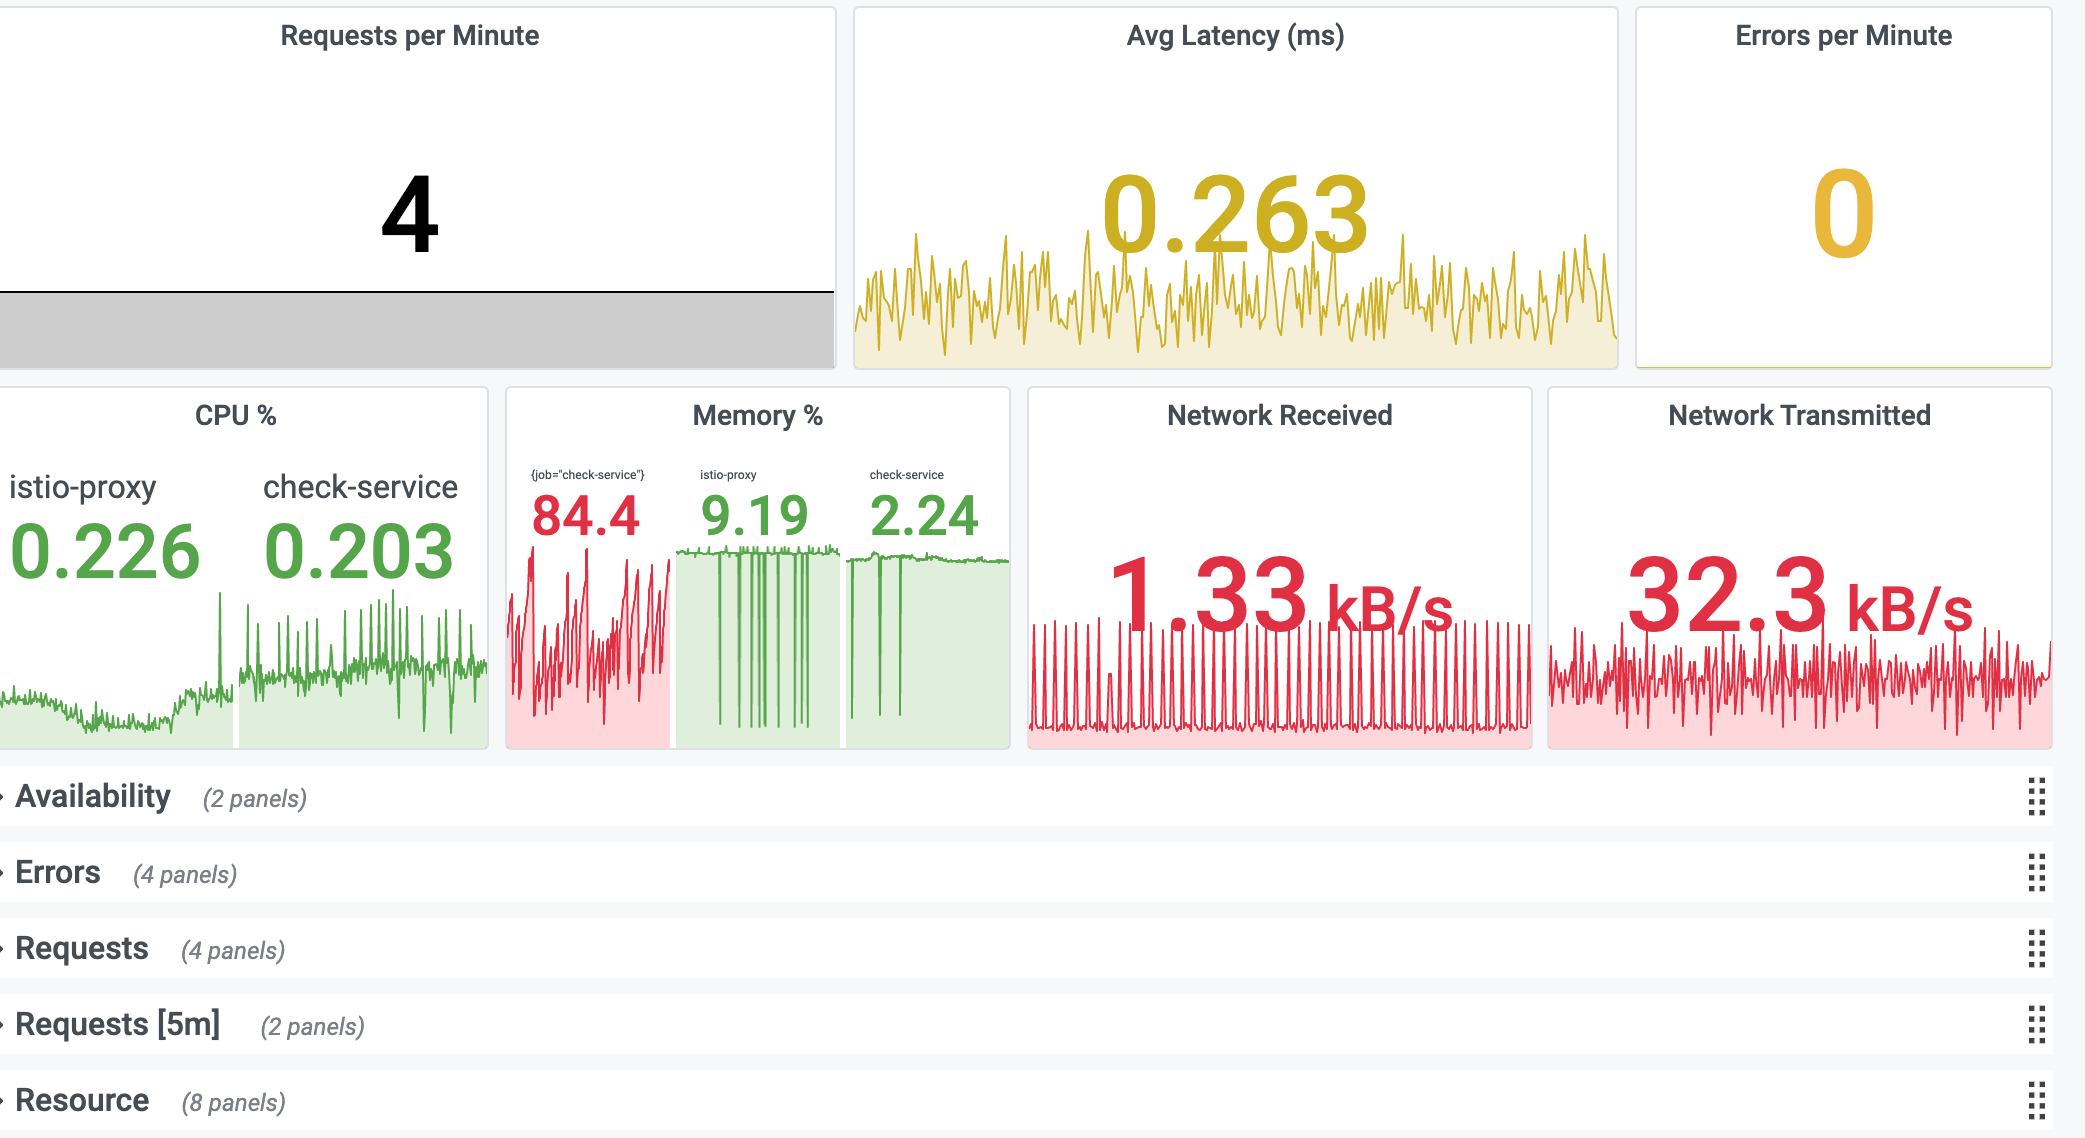
You can include any custom dashboard from the community. For example, this dashboard shows Flask specific metrics directly as a custom dashboard for your service.

Was this page helpful?
Related resources from Grafana Labs


