What is observability?
Observability is the process of making a system’s internal state more transparent. Systems are made observable by the data they produce, which in turn helps you to determine if your infrastructure or application is healthy and functioning normally.Why we need observability
Observability is crucial for managing current technology due to:
- The use of microservices and containers
- The complexity of today’s systems
Microservices and containers
Technology has moved to virtualization and microservices. Many applications are now split into microservices. Each microservice does one thing, such as verify an address or check a database for product availability. A query is sent to the microservice, and requested information is returned. Microservices are convenient because they can be:
- Updated or replaced without updating or replacing the software for an entire application
- Scaled quickly, such as adding additional instances of microservices to handle increased load (for example, a holiday shopping rush or a payroll processing cycle)
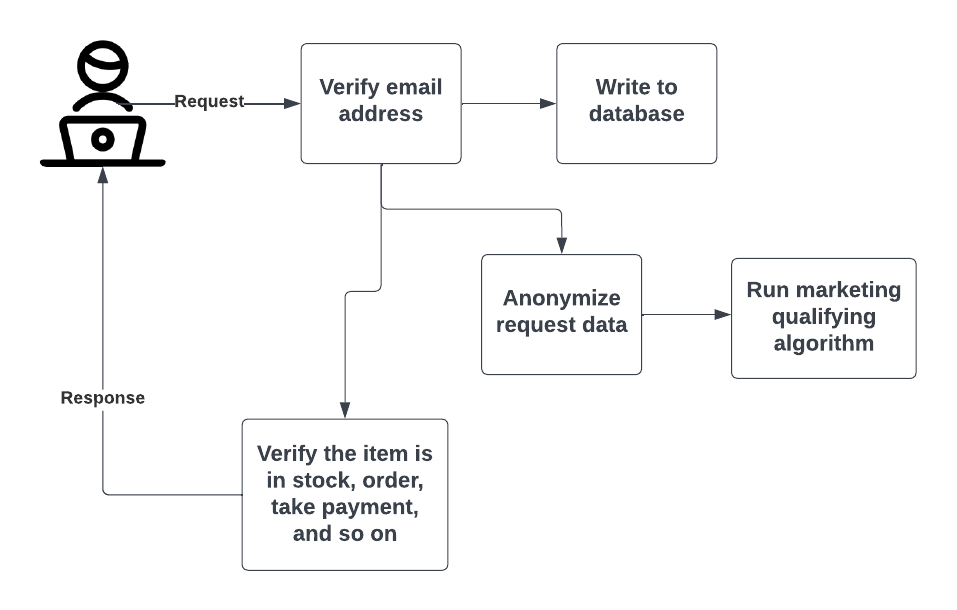
The following process diagram shows a small part of an application. A user submits a purchase request for an item in an online shop. Each task related to that request might be sent to a different microservice.

These microservices are often run in separate, individual containers. Containers are like virtual machines, but require even fewer resources to run, are faster to deploy or remove, and offer even greater flexibility in how and where they are run. You may have many instances of some microservice containers and only a few or one of others. It all depends on the need.
Containers and microservices allow changes to the application infrastructure to be automated, spinning up and shutting down components as needed to handle the application load. Compared to other software architectures, this style of architecture is much more flexible and easier to adjust according to business needs. However, these rapid changes to components pose challenges to understanding the entire system’s state.
The complexity of current systems
In the past, we could use metrics to determine where problems might be happening or where slowdowns and potential issues might arise. Then we could look at the log entries from one or two physical servers and software running on them to find out what specific errors exist so we could take corrective action.
Even at the scale of running our own software in our own data center, these methods alone no longer meet our needs. Systems are increasingly complex and change so quickly that it is often difficult or impossible to draw an accurate system architecture diagram.
Now we face having to answer these kinds of questions:
- How much network traffic is being used to access a specific microservice?
- Is the current level of load balancing handling that traffic well?
- Do new instances need to be spun up or existing ones deleted?
- Is the container orchestration running correctly?
What data is collected
To understand the state of a system, we need time-series data, which includes a time stamp and a numeric value. (You can explore more about time-series data in Time-series data and dimensions). The three fundamental types of data that are collected are metrics, logs, and traces. However, there are additional ones we can gather.
Metrics
A metric is a numeric measurement that is timestamped to indicate when it was collected. If you track an application or system, you might measure:
- How many system resources are currently being used, such as memory or storage
- How long it takes a particular service to respond to a request
- How many users are accessing the application right now
Metrics can tell you how often something is failing, but not why.
Logs
Logs are time-stamped records of events that happen over time, such as error log files. Logs help you understand the behavior of infrastructure and applications as well as of users and business. For example, you can use logs to answer these questions:
- How many requests are processed per second?
- What percentage of requests are failing?
- Of users who visited in the last month, how many of them returned this month?
- How many distinct users are visiting the site per day?
Logs often contain the root cause of a failure or issue. Logs must be collected together (called aggregation), stored, and indexed.
Traces
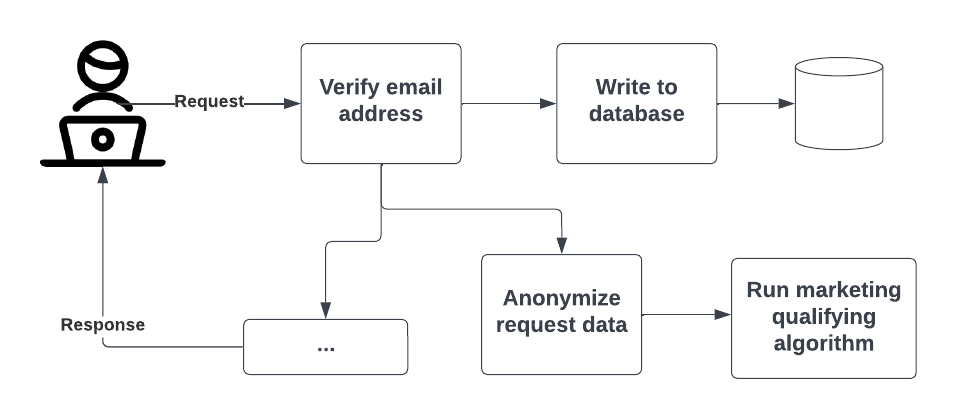
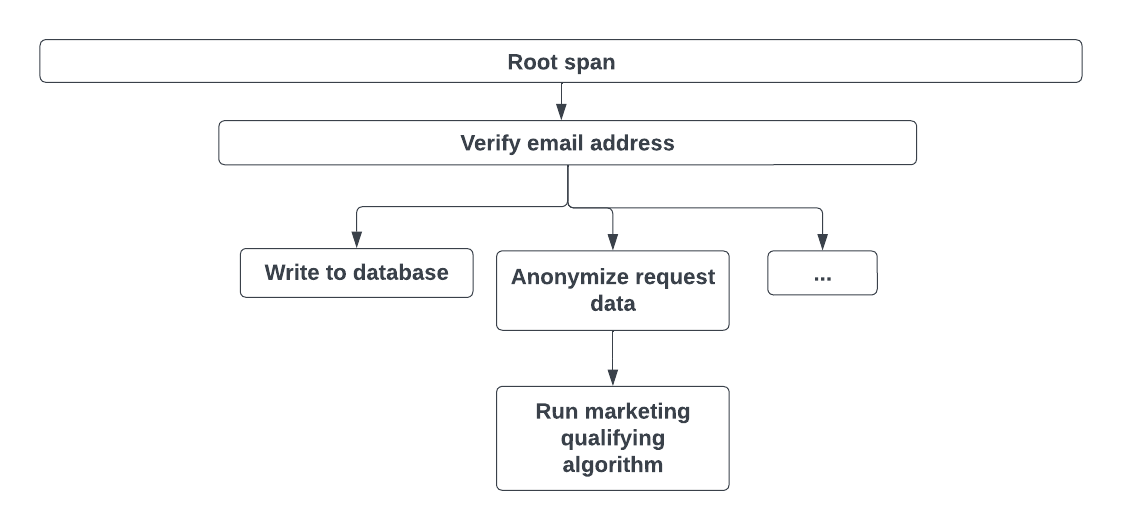
A trace provides end-to-end insight because it tracks a system request as it travels through multiple locations/components of a system that is distributed or based on microservices. Traces are made up of spans. Spans record how long each part of a request takes, such as this simple request shown in the following process diagram.

The following graphic shows the root span that records the length of the entire request. A root span has child spans for each part of processing the request.

Traces make it easier to understand root causes and locate which parts of the system are slow or having other problems.
Profiles
A profile is a measurement of the resource usage and duration of an application’s function. A continuous profile continuously gathers this data.
You can use continuous profiling to identify details about your application’s performance, down to the code level. For more information, refer to Benefits of continuous profiling.
Other data collected
As the observability discipline has matured, we now have more tools we can use to make systems more transparent, including:
Events in Kubernetes Clusters: Typically indicate a change of state with a Node, Pod, or container. You can use events to understand:
- Failure of containers
- Pods that are evicted
- Failure of Pods to mount or attach
- Nodes that are not ready for Pod scheduling
Exemplars: A specific type of trace that contains an ID. An exemplar contains the observed value together with an optional timestamp and arbitrary trace IDs, which are typically used to reference a trace.
How data is collected
If everything is in disparate microsystems, how do we collect data? Code must be “instrumented” so that data can be collected about how the application is behaving and performing. This means additional code is added to the application code, either by modifying it at the source or waiting until it is compiled. After instrumentation, data can be collected as the application is used.
There are numerous applications that can gather telemetry data, and these apps can be either proprietary or open source. A few open source applications are:
- Prometheus, to collect and store metrics
- Grafana Cloud Traces, to collect and store trace data and exemplars
- Grafana Cloud Logs, to aggregate and store logs
Why data storage is needed
All time-series data requires storage that accommodates the time stamp on the data and the need for quickly retrieving data from a query. The data is also aggregated for fast queries and responses, and efficient storage. By storing time-series data in one place, you can easily compare the current state of a system or application with historical data.
Observability - more than monitoring
Observability is often talked about together with infrastructure monitoring or application performance monitoring. While the two are related, they are not the same. Monitoring focuses only on collecting data.
Both metrics monitoring and logging presume you know the right questions to ask and have configured your application and platform to give you that data. With microservices, containers, and automated adjustments to infrastructure based on need, you don’t always know what to ask, much less whether a measurement tells you anything useful. You aren’t always certain what standard to measure against.
Observability is a more holistic approach to understanding and managing complex systems.
It involves collecting data from all parts of the system to create a deep understanding of the system’s internal workings and how these interact with each other. Observability focuses on understanding and interpreting data to make the system’s behavior and performance as transparent as possible. It also requires a means of making the data easily available for humans to interpret.
An observability system enables system operators, DevOps practitioners, and site reliability engineers to ask questions across the information gathered. These are questions that are not anticipated in advance, but rather questions that arise due to unexpected or novel events within a system.


