Apache Airflow integration for Grafana Cloud
Apache Airflow is an open-source platform for programmatically authoring, scheduling, and monitoring workflows, enabling the orchestration of complex data pipelines and task dependencies. This integration for Grafana Cloud allows users to collect metrics, scheduler logs, and task logs for monitoring an Apache Airflow system.
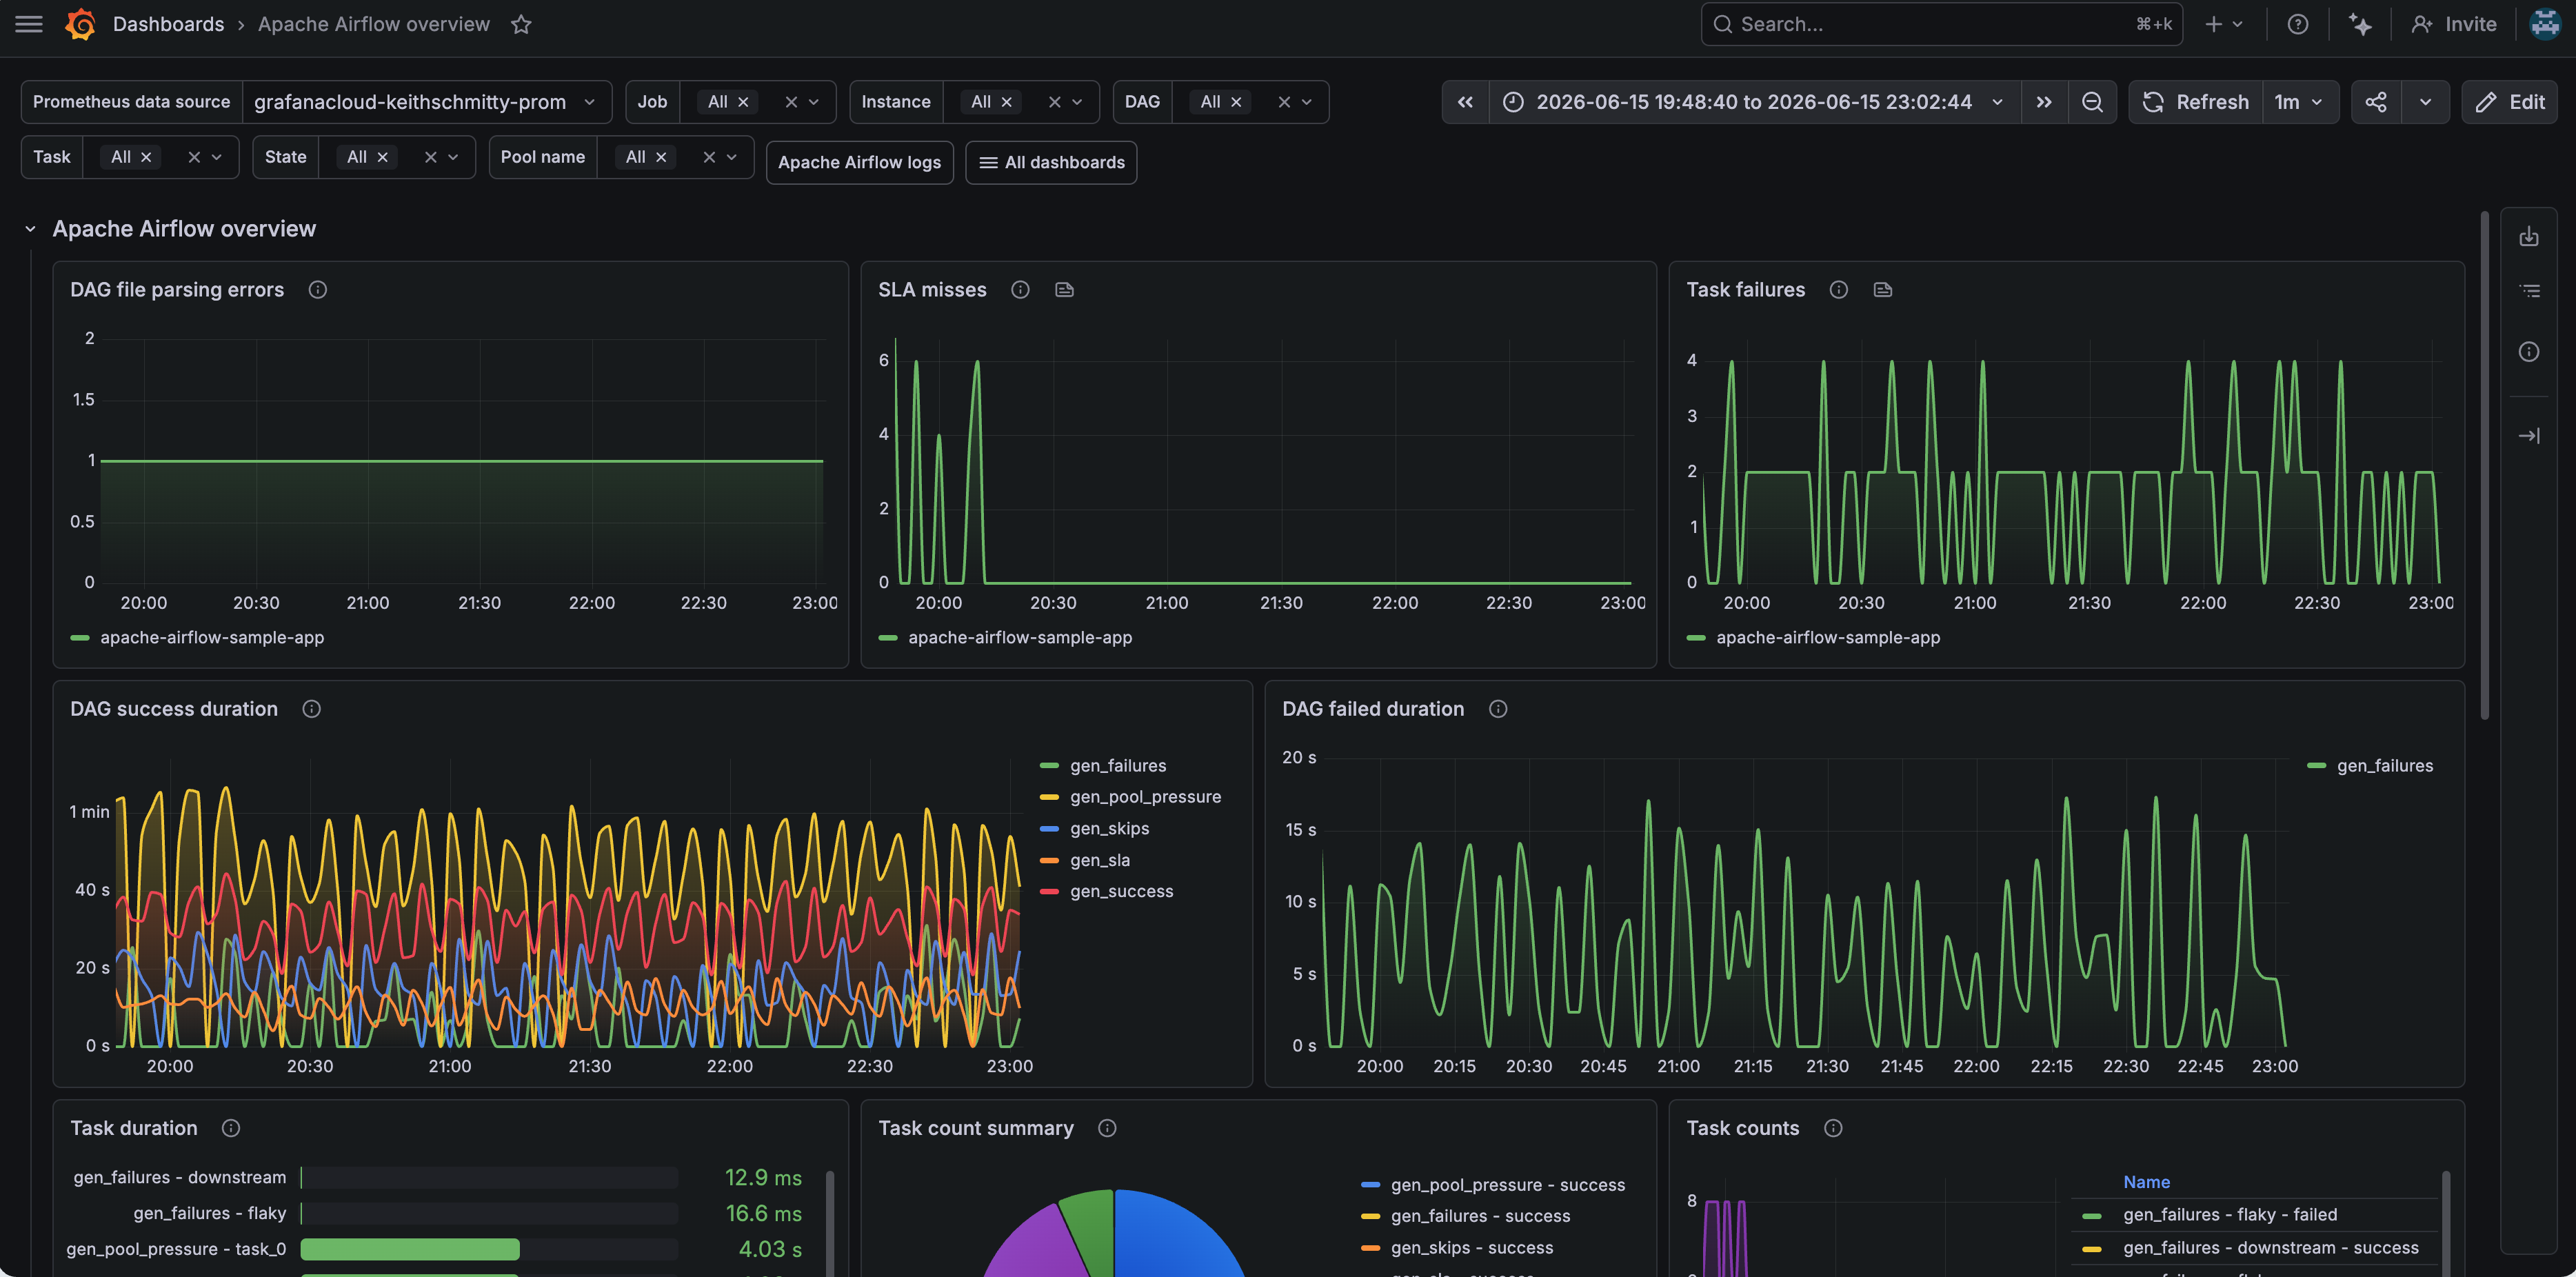
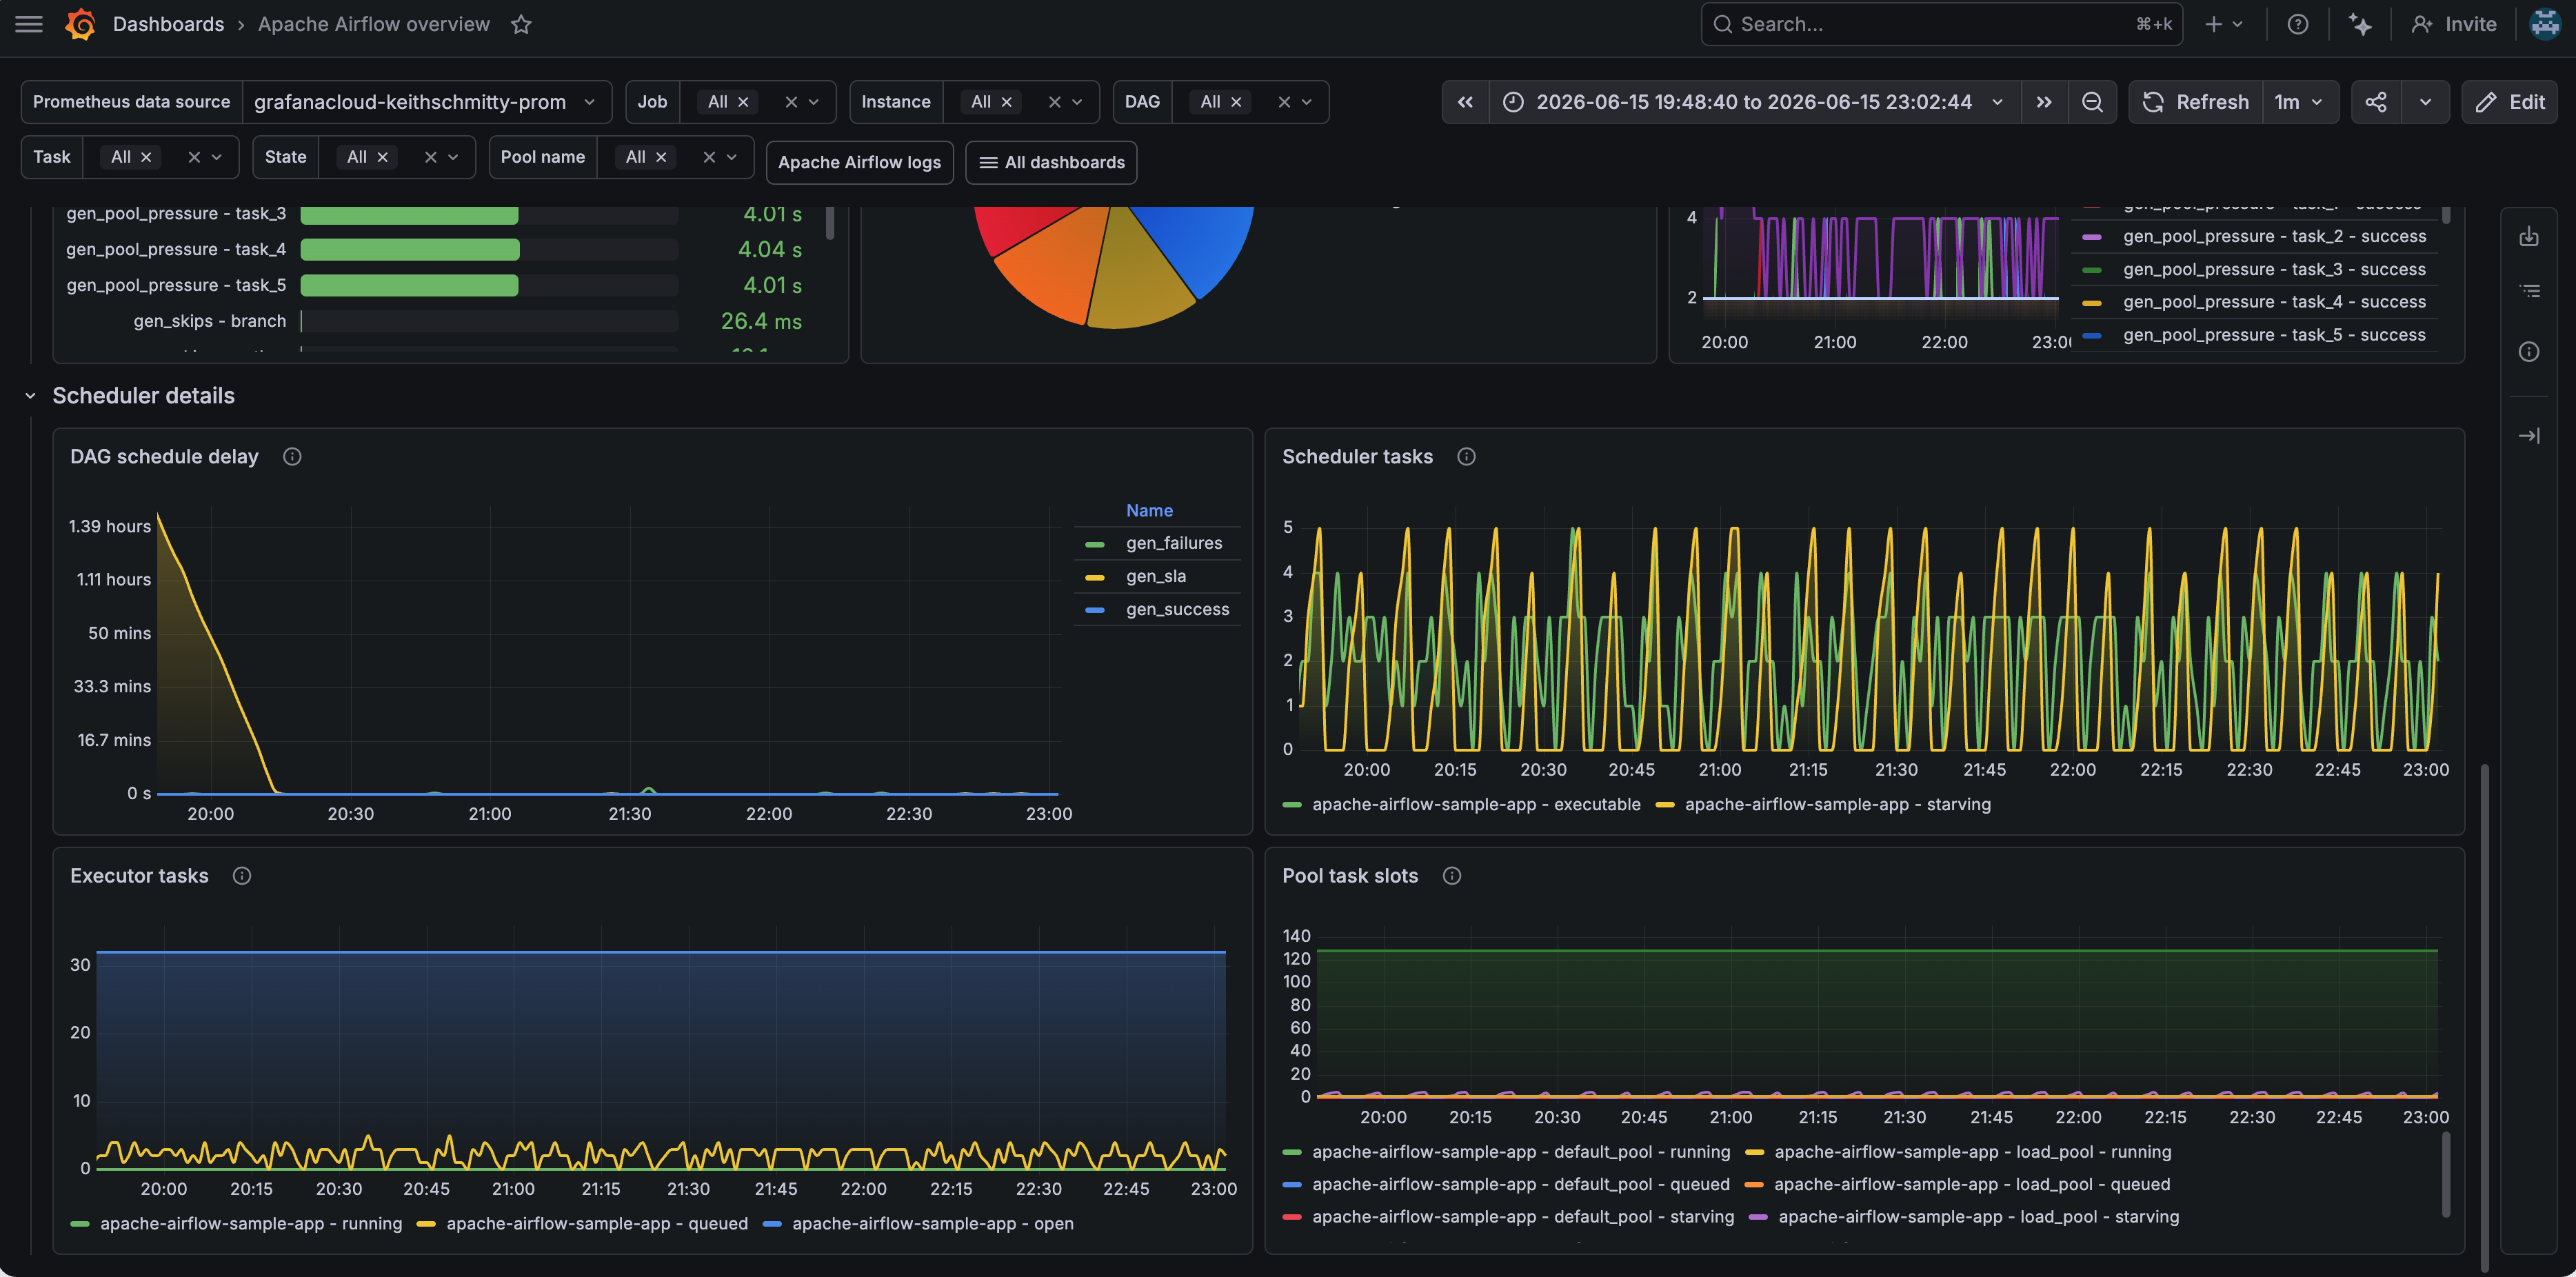
Metrics include DAG (Directed Acyclic Graph) failures, DAG durations, task failures, task durations, scheduler details, executor tasks, and pool task slots for an Apache Airflow system.
This integration supports Apache Airflow versions 2.5.0+.
This integration includes 4 useful alerts and 2 pre-built dashboards to help monitor and visualize Apache Airflow metrics and logs.
Before you begin
In order for the integration to properly work, Airflow must be setup to send metrics to StatsD.
Setup Airflow to send metrics to StatsD
First you must install the StatsD requirement:
pip install 'apache-airflow[statsd]'Also, the following lines must be added to your airflow.cfg:
[metrics]
statsd_on = True
statsd_host = localhost
statsd_port = 8125
statsd_prefix = airflow
Install Apache Airflow integration for Grafana Cloud
- In your Grafana Cloud stack, click Connections in the left-hand menu.
- Find Apache Airflow and click its tile to open the integration.
- Review the prerequisites in the Configuration Details tab and set up Grafana Alloy to send Apache Airflow metrics and logs to your Grafana Cloud instance.
- Click Install to add this integration’s pre-built dashboards and alerts to your Grafana Cloud instance, and you can start monitoring your Apache Airflow setup.
Configuration snippets for Grafana Alloy
Simple mode
These snippets are configured to scrape a single Apache Airflow instance running locally with default ports.
First, manually copy and append the following snippets into your alloy configuration file.
Metrics instructions
This integration uses the prometheus.exporter.statsd component to generate metrics from a Apache Airflow instance.
Make sure to change listen_udp in the snippet according to your environment.
The statsd exporter component requires an external mapping configuration file. You can download the correct mapping file for this integration here.
If you’re deploying to Kubernetes using the official helm chart, the statsd exporter is included with a custom mapping configuration, but the configuration will need to be updated.
For the full array of configuration options, refer to the prometheus.exporter.statsd component reference documentation.
This exporter must be linked with a discovery.relabel component to apply the necessary relabelings.
For each Apache Airflow instance to be monitored you must create a pair of these components.
Configure the following properties within each discovery.relabel component:
instancelabel:constants.hostnamesets theinstancelabel to your Grafana Alloy server hostname. If that is not suitable, change it to a value uniquely identifies this Apache Airflow instance. Make sure this label value is the same for all telemetry data collected for this instance.
You can then scrape them by including each discovery.relabel under targets within the prometheus.scrape component.
Integrations snippets
prometheus.exporter.statsd "integrations_statsd_exporter" {
	listen_udp = "localhost:8125"
  mapping_config_path = "statsd_mapping.yaml"
}

discovery.relabel "integrations_statsd_exporter" {
	targets = prometheus.exporter.statsd.integrations_statsd_exporter.targets

	rule {
		target_label = "job"
		replacement  = "integrations/apache-airflow"
	}

	rule {
		target_label = "instance"
		replacement  = constants.hostname
	}
}

prometheus.scrape "integrations_statsd_exporter" {
	targets    = discovery.relabel.integrations_statsd_exporter.output
	forward_to = [prometheus.remote_write.metrics_service.receiver]
	job_name   = "integrations/statsd_exporter"
}
Advanced mode
The following snippets provide examples to guide you through the configuration process.
To instruct Grafana Alloy to scrape your Apache Airflow instances, manually copy and append the snippets to your alloy configuration file, then follow subsequent instructions.
Advanced integrations snippets
prometheus.exporter.statsd "integrations_statsd_exporter" {
	listen_udp = "localhost:8125"
  mapping_config_path = "statsd_mapping.yaml"
}

discovery.relabel "integrations_statsd_exporter" {
	targets = prometheus.exporter.statsd.integrations_statsd_exporter.targets

	rule {
		target_label = "job"
		replacement  = "integrations/apache-airflow"
	}

	rule {
		target_label = "instance"
		replacement  = constants.hostname
	}
}

prometheus.scrape "integrations_statsd_exporter" {
	targets    = discovery.relabel.integrations_statsd_exporter.output
	forward_to = [prometheus.remote_write.metrics_service.receiver]
	job_name   = "integrations/statsd_exporter"
}
This integration uses the prometheus.exporter.statsd component to generate metrics from a Apache Airflow instance.
Make sure to change listen_udp in the snippet according to your environment.
The statsd exporter component requires an external mapping configuration file. You can download the correct mapping file for this integration here.
If you’re deploying to Kubernetes using the official helm chart, the statsd exporter is included with a custom mapping configuration, but the configuration will need to be updated.
For the full array of configuration options, refer to the prometheus.exporter.statsd component reference documentation.
This exporter must be linked with a discovery.relabel component to apply the necessary relabelings.
For each Apache Airflow instance to be monitored you must create a pair of these components.
Configure the following properties within each discovery.relabel component:
instancelabel:constants.hostnamesets theinstancelabel to your Grafana Alloy server hostname. If that is not suitable, change it to a value uniquely identifies this Apache Airflow instance. Make sure this label value is the same for all telemetry data collected for this instance.
You can then scrape them by including each discovery.relabel under targets within the prometheus.scrape component.
Advanced logs snippets
darwin
local.file_match "logs_integrations_integrations_apache_airflow" {
	path_targets = [{
		__address__ = "localhost",
		__path__    = "<airflow_home>/logs/dag_id=*/**/*.log",
		instance    = constants.hostname,
		job         = "integrations/apache-airflow",
	}, {
		__address__ = "localhost",
		__path__    = "<airflow_home>/logs/scheduler/latest/*.py.log",
		instance    = constants.hostname,
		job         = "integrations/apache-airflow",
	}]
}

loki.process "logs_integrations_integrations_apache_airflow" {
	forward_to = [loki.write.grafana_cloud_loki.receiver]

	stage.match {
		selector = format("{job=\"integrations/apache-airflow\",instance=\"%s\"}", constants.hostname)

		stage.regex {
			expression = "<airflow_home>/logs/dag_id=(?P<dag_id>\\S+?)/.*/task_id=(?P<task_id>\\S+?)/.*log"
			source     = "filename"
		}

		stage.labels {
			values = {
				dag_id  = null,
				task_id = null,
			}
		}
	}

	stage.match {
		selector = format("{job=\"integrations/apache-airflow\",instance=\"%s\"}", constants.hostname)

		stage.regex {
			expression = "<airflow_home>/logs/scheduler/latest/(?P<dag_file>\\S+?)\\.log"
			source     = "filename"
		}

		stage.labels {
			values = {
				dag_file = null,
			}
		}
	}

	stage.multiline {
		firstline     = "\\[\\d+-\\d+-\\d+T\\d+:\\d+:\\d+\\.\\d+\\+\\d+\\]"
		max_lines     = 0
		max_wait_time = "3s"
	}
}

loki.source.file "logs_integrations_integrations_apache_airflow" {
	targets    = local.file_match.logs_integrations_integrations_apache_airflow.targets
	forward_to = [loki.process.logs_integrations_integrations_apache_airflow.receiver]
}
To monitor your Apache Airflow instance logs, you will use a combination of the following components:
If you’re deploying to Kubernetes using the official helm chart, the scheduler and task logs will need to be persisted to a volume and an additional Alloy pod will need to be deployed with those volumes mounted.
local.file_match defines where to find the log file to be scraped. Change the following properties according to your environment:
__address__: The Apache Airflow instance address__path__: The path to the log file.instancelabel:constants.hostnamesets theinstancelabel to your Grafana Alloy server hostname. If that is not suitable, change it to a value uniquely identifies this Apache Airflow instance. Make sure this label value is the same for all telemetry data collected for this instance.
loki.process defines how to process logs before sending it to Loki.
loki.source.file sends logs to Loki.
Kubernetes sidecars for log collection
If you’re running Airflow using the official helm chart, additional steps are required for collecting logs from the environment.
ConfigMaps
You’ll want to clone down the repo, as the extraConfigMaps configuration in values.yaml is not suitable. You’ll have to add additional YAML
files to the /templates/configmaps directory.
Here are examples from the sample application for the Alloy configurations that will need to be tailored to your environment.
Sidecars
To setup the Alloy sidecars for the task and scheduler logs, you’ll update the values.yaml file. There are extraContainers sections for the worker and scheduler pods.
Here’s example YAML for the task logs sidecar container. It will be Alloy with volume mounts for the custom alloy configuration and the Airflow logs directory.
  extraContainers:
    - name: alloy
      image: grafana/alloy:latest
      volumeMounts:
      - name: alloy-task-logs-config
        mountPath: /etc/alloy/config.alloy
        subPath: config.alloy
      - name: logs
        mountPath: /opt/airflow/logs/
      securityContext:
        runAsUser: 0
        runAsGroup: 0
Following the addition of the Alloy configurations and the Alloy sidecars, log collection should be working.
linux
local.file_match "logs_integrations_integrations_apache_airflow" {
	path_targets = [{
		__address__ = "localhost",
		__path__    = "<airflow_home>/logs/dag_id=*/**/*.log",
		instance    = constants.hostname,
		job         = "integrations/apache-airflow",
	}, {
		__address__ = "localhost",
		__path__    = "<airflow_home>/logs/scheduler/latest/*.py.log",
		instance    = constants.hostname,
		job         = "integrations/apache-airflow",
	}]
}

loki.process "logs_integrations_integrations_apache_airflow" {
	forward_to = [loki.write.grafana_cloud_loki.receiver]

	stage.match {
		selector = format("{job=\"integrations/apache-airflow\",instance=\"%s\"}", constants.hostname)

		stage.regex {
			expression = "<airflow_home>/logs/dag_id=(?P<dag_id>\\S+?)/.*/task_id=(?P<task_id>\\S+?)/.*log"
			source     = "filename"
		}

		stage.labels {
			values = {
				dag_id  = null,
				task_id = null,
			}
		}
	}

	stage.match {
		selector = format("{job=\"integrations/apache-airflow\",instance=\"%s\"}", constants.hostname)

		stage.regex {
			expression = "<airflow_home>/logs/scheduler/latest/(?P<dag_file>\\S+?)\\.log"
			source     = "filename"
		}

		stage.labels {
			values = {
				dag_file = null,
			}
		}
	}

	stage.multiline {
		firstline     = "\\[\\d+-\\d+-\\d+T\\d+:\\d+:\\d+\\.\\d+\\+\\d+\\]"
		max_lines     = 0
		max_wait_time = "3s"
	}
}

loki.source.file "logs_integrations_integrations_apache_airflow" {
	targets    = local.file_match.logs_integrations_integrations_apache_airflow.targets
	forward_to = [loki.process.logs_integrations_integrations_apache_airflow.receiver]
}
To monitor your Apache Airflow instance logs, you will use a combination of the following components:
If you’re deploying to Kubernetes using the official helm chart, the scheduler and task logs will need to be persisted to a volume and an additional Alloy pod will need to be deployed with those volumes mounted.
local.file_match defines where to find the log file to be scraped. Change the following properties according to your environment:
__address__: The Apache Airflow instance address__path__: The path to the log file.instancelabel:constants.hostnamesets theinstancelabel to your Grafana Alloy server hostname. If that is not suitable, change it to a value uniquely identifies this Apache Airflow instance. Make sure this label value is the same for all telemetry data collected for this instance.
loki.process defines how to process logs before sending it to Loki.
loki.source.file sends logs to Loki.
Kubernetes sidecars for log collection
If you’re running Airflow using the official helm chart, additional steps are required for collecting logs from the environment.
ConfigMaps
You’ll want to clone down the repo, as the extraConfigMaps configuration in values.yaml is not suitable. You’ll have to add additional YAML
files to the /templates/configmaps directory.
Here are examples from the sample application for the Alloy configurations that will need to be tailored to your environment.
Sidecars
To setup the Alloy sidecars for the task and scheduler logs, you’ll update the values.yaml file. There are extraContainers sections for the worker and scheduler pods.
Here’s example YAML for the task logs sidecar container. It will be Alloy with volume mounts for the custom alloy configuration and the Airflow logs directory.
  extraContainers:
    - name: alloy
      image: grafana/alloy:latest
      volumeMounts:
      - name: alloy-task-logs-config
        mountPath: /etc/alloy/config.alloy
        subPath: config.alloy
      - name: logs
        mountPath: /opt/airflow/logs/
      securityContext:
        runAsUser: 0
        runAsGroup: 0
Following the addition of the Alloy configurations and the Alloy sidecars, log collection should be working.
Kubernetes instructions
Before you begin with Kubernetes
Please note: These instructions assume the use of the Kubernetes Monitoring Helm chart
In order for the integration to properly work, Airflow must be setup to send metrics to StatsD.
Setup Airflow to send metrics to StatsD
First you must install the StatsD requirement:
pip install 'apache-airflow[statsd]'Also, the following lines must be added to your airflow.cfg:
[metrics]
statsd_on = True
statsd_host = localhost
statsd_port = 8125
statsd_prefix = airflow
Configuration snippets for Kubernetes Helm chart
The following snippets provide examples to guide you through the configuration process.
To scrape your Apache Airflow instances, manually modify your Kubernetes Monitoring Helm chart with these configuration snippets.
Replace any values between the angle brackets <> in the provided snippets with your desired configuration values.
Metrics snippets
alloy-metrics:
    extraConfig: |-
        prometheus.scrape "integrations_airflow_statsd_exporter" {
            targets    = [{"__address__" = "<airflow-statsd-service>.<airflow-namespace>.svc.cluster.local:9102"}]
            forward_to = [prometheus.remote_write.grafana_cloud_metrics.receiver]
            job_name   = "integrations/apache-airflow"
        }
Logs snippets
<q>These instructions are being written under the assumption that the <a href="https://airflow.apache.org/docs/helm-chart/stable/index.html">official helm chart</a> is in use. If not, there may be additional work.</q>

<p>
To collect logs from Apache Airflow, Alloy sidecars must be added to the deployment configuration for the scheduler and worker pods.
</p>

<p>
Please refer to <a href="https://grafana.com/docs/grafana-cloud/monitor-infrastructure/integrations/integration-reference/integration-apache-airflow/#kubernetes-sidecars-for-log-collection-1">these instructions for further details</a>.
</p>
Dashboards
The Apache Airflow integration installs the following dashboards in your Grafana Cloud instance to help monitor your system.
- Apache Airflow logs
- Apache Airflow overview
Apache Airflow overview (1/2)
Apache Airflow overview (2/2)
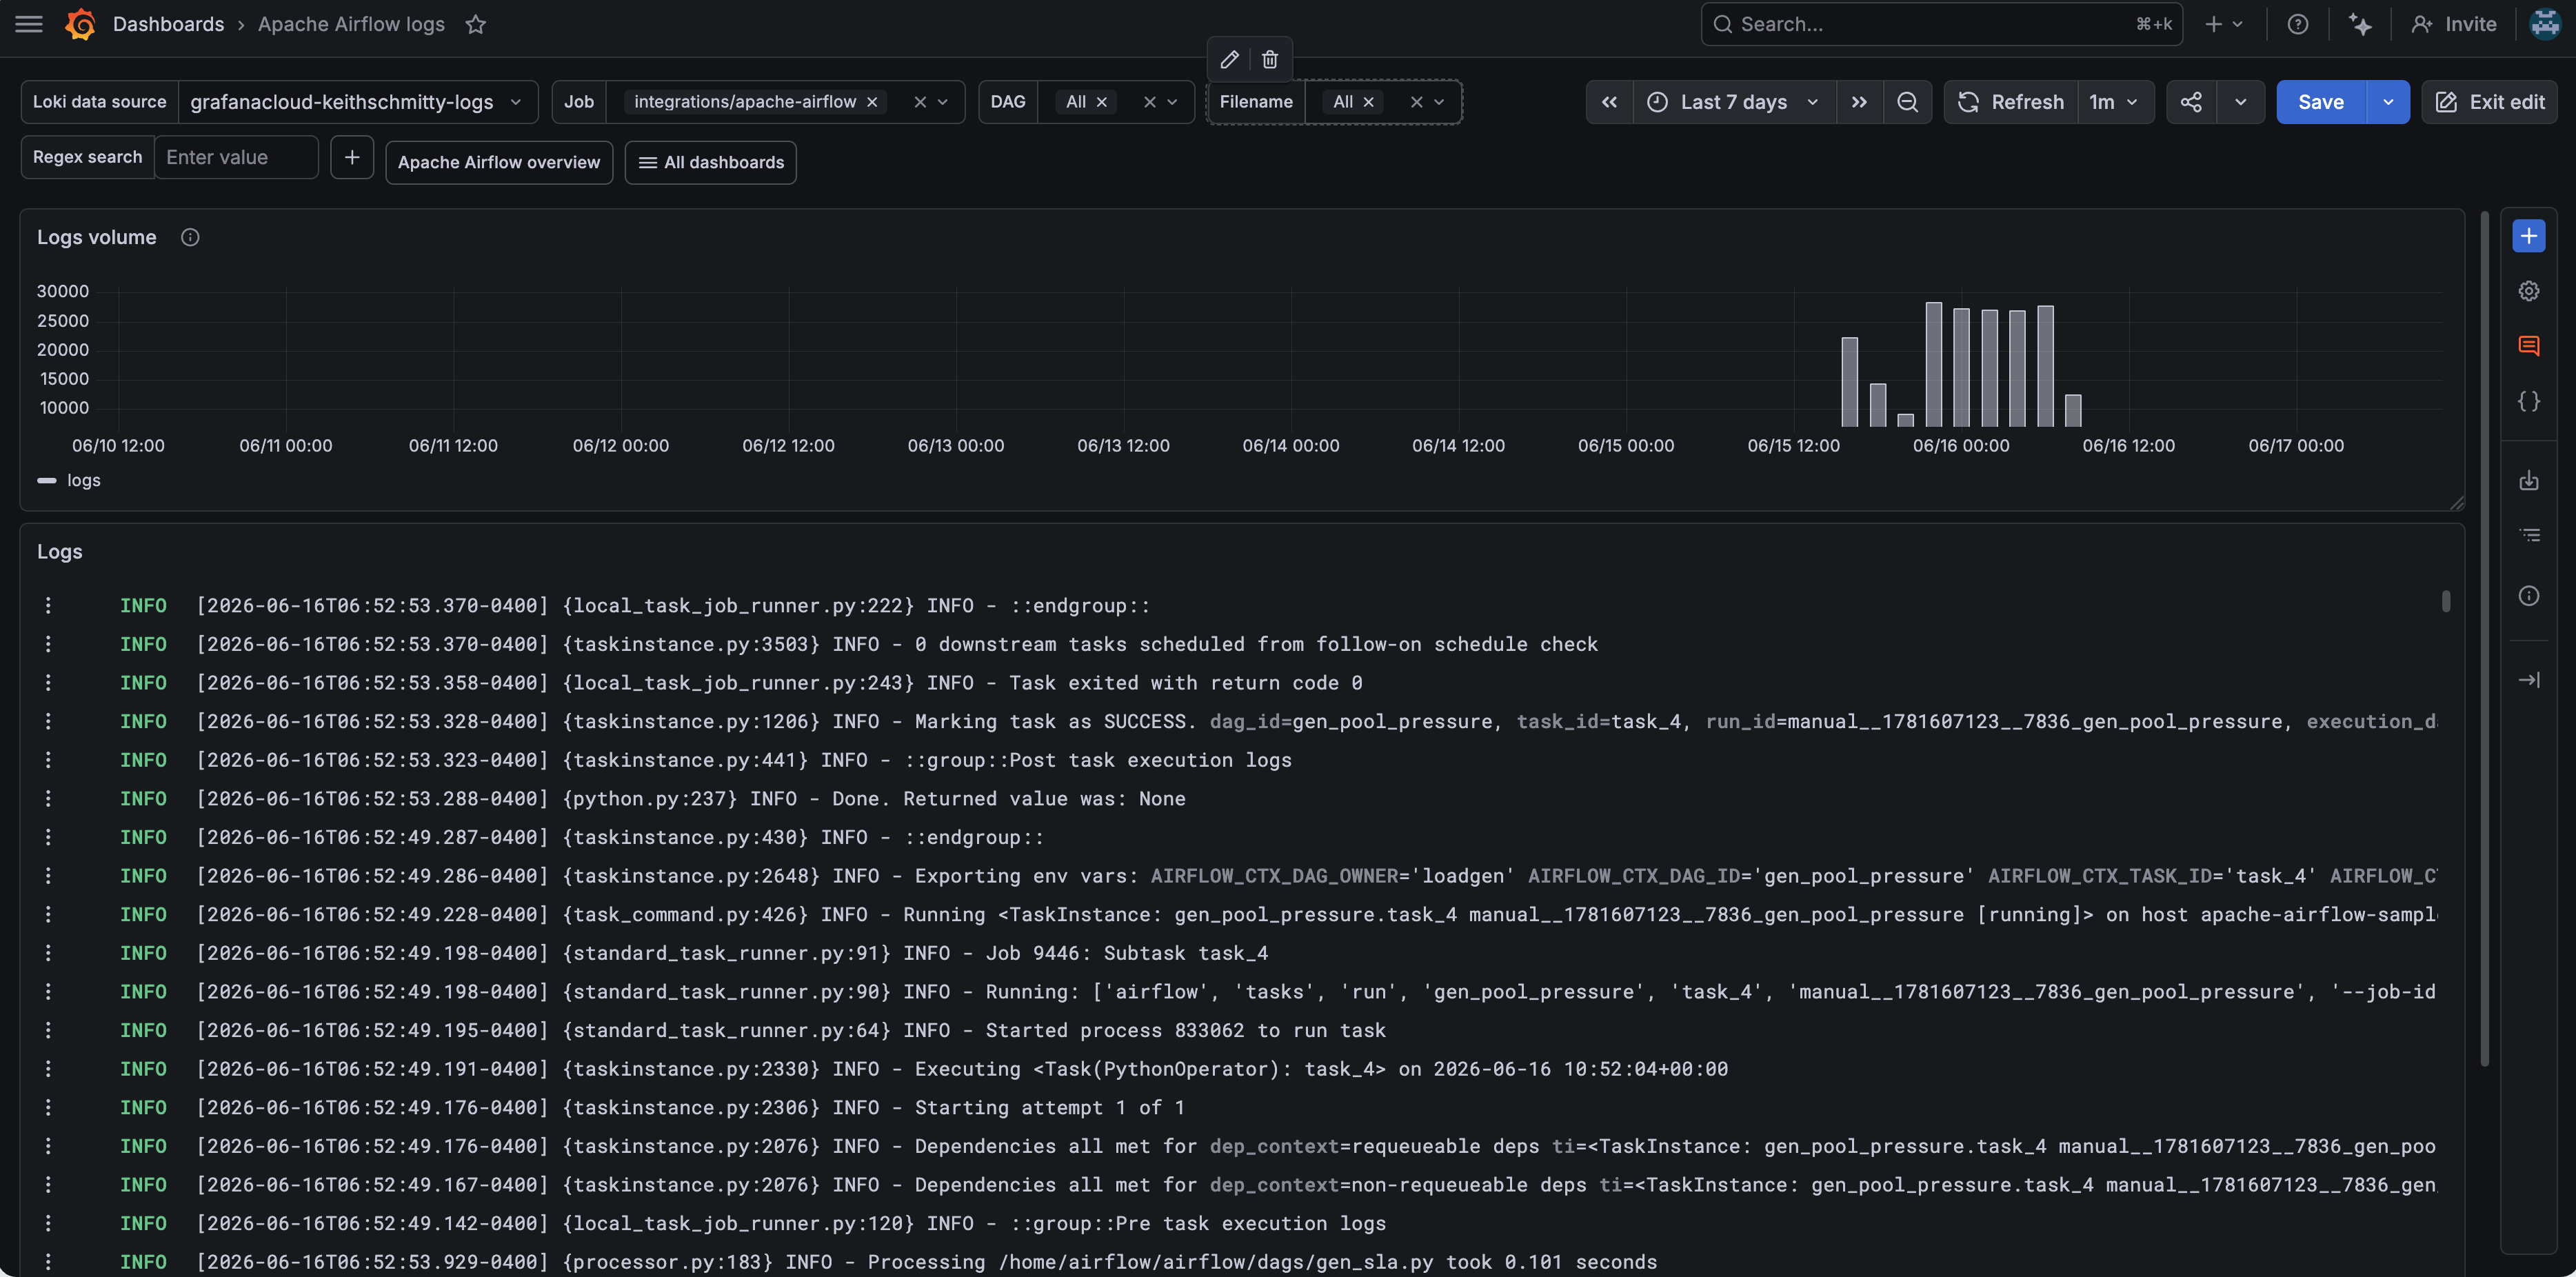
Apache Airflow logs
Alerts
The Apache Airflow integration includes the following useful alerts:
Metrics
The most important metrics provided by the Apache Airflow integration, which are used on the pre-built dashboards and Prometheus alerts, are as follows:
- airflow_dag_processing_import_errors
- airflow_dag_task_duration_count
- airflow_dag_task_duration_sum
- airflow_dagbag_size
- airflow_dagrun_duration_failed_count
- airflow_dagrun_duration_failed_sum
- airflow_dagrun_duration_success_count
- airflow_dagrun_duration_success_sum
- airflow_dagrun_schedule_delay_count
- airflow_dagrun_schedule_delay_sum
- airflow_executor_open_slots
- airflow_executor_queued_tasks
- airflow_executor_running_tasks
- airflow_pool_open_slots
- airflow_pool_queued_slots
- airflow_pool_running_slots
- airflow_pool_starving_tasks
- airflow_scheduler_tasks_executable
- airflow_scheduler_tasks_starving
- airflow_sla_missed
- airflow_task_finish_total
- airflow_ti_failures
- up
Changelog
# 1.1.1 - June 2026

* Fixed issue with default filtering selectors

# 1.1.0 - June 2026

* Updated dashboards to follow new stylistic standards
* Added a dedicated "Apache Airflow logs" dashboard for improved log viewing
* Renamed alert "ApacheAirflowDAGScheduleDelayWarningLevel" to "ApacheAirflowDAGScheduleDelayWarning (Warning)"
* Renamed alert "ApacheAirflowDAGScheduleDelayCriticalLevel" to "ApacheAirflowDAGScheduleDelayCritical (Critical)"

# 1.0.0 - June 2024

* Added cluster selector to dashboards for kubernetes support
* Added default cluster label to agent config

# 0.0.4 - September 2023

* Update Grafana Agent configuration snippets to include filtered metrics used in gauge panels

# 0.0.3 - September 2023

* New Filter Metrics option for configuring the Grafana Agent, which saves on metrics cost by dropping any metric not used by this integration. Beware that anything custom built using metrics that are not on the snippet will stop working.
* New hostname relabel option, which applies the instance name you write on the text box to the Grafana Agent configuration snippets, making it easier and less error prone to configure this mandatory label.

# 0.0.2 - August 2023

* Add regex filter for logs datasource

# 0.0.1 - June 2023

* Initial release
Cost
By connecting your Apache Airflow instance to Grafana Cloud, you might incur charges. To view information on the number of active series that your Grafana Cloud account uses for metrics included in each Cloud tier, see Active series and dpm usage and Cloud tier pricing.


