Troubleshoot PDC issues
This document provides troubleshooting guidance for PDC agent issues and connectivity problems with PDC-connected data sources.
Common PDC errors
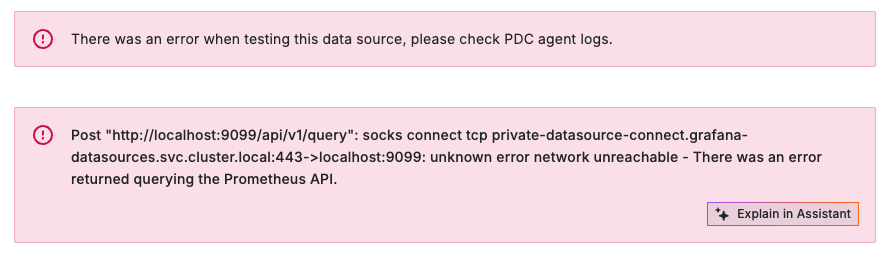
Some data source query errors have an error message containing a string like socks connect tcp private-datasource-connect.hosted-grafana.svc.cluster.local:443<ADDRESS>:<PORT>: unknown error <ERROR>. In this string, <ADDRESS> and <PORT> are the data source endpoint the agent tried to reach, and <ERROR> describes why the connection failed. These errors can appear wherever a query is made in the UI, including the data source configuration page, Explore, or within a panel.
network unreachable
The PDC service cannot find a connected PDC agent to route the request to. This typically means no agents are running or all agents have lost their connection.
To verify agent connectivity:
- In Grafana, go to Connections > Private data source connections and check that at least one agent shows as connected.
- Alternatively, query the
grafanacloud_grafana_pdc_connected_agentsmetric in your stack’sgrafanacloud-usagedata source to confirm the connected agent count is greater than zero.
If agents are running but not showing as connected, check that the agent can reach the PDC API and SSH gateway endpoints. Refer to the network requirements for the required egress endpoints.
host unreachable
A PDC agent received the request but failed to establish a TCP connection to the data source within 10 seconds.
To resolve this:
- Verify that the data source hostname resolves correctly from the network where the PDC agent is running (for example, using
nslookupordig). - Check that firewall rules allow the agent to reach the data source on the specified port.
- If you are using
PermitRemoteOpen, confirm that the target host and port are included in the allow list. - Verify that the data source service is running and accepting connections.
connection refused
The PDC agent reached the data source host but nothing is listening on the specified port. Unlike host unreachable, the host itself is reachable but the service is not accepting connections.
To resolve this:
- Verify that the data source service is running on the expected port.
- Check that the port number configured in the Grafana data source settings matches the port the service is listening on.
- If the service binds to
localhostor127.0.0.1, it may not be accessible from the PDC agent. Ensure the service listens on an interface reachable from the agent’s network.
general SOCKS server failure
This error can have multiple causes:
- Agent overload: The PDC agent’s CPU is saturated and it cannot process additional requests. Refer to PDC agent overload and unresponsiveness for resolution steps.
PermitRemoteOpenblocking the connection: The agent’sPermitRemoteOpenconfiguration does not include the target host and port. Check the agent’s-ssh-flagconfiguration and add the missing destination. If you use-use-gossh, also check the-permit-domainsflag.- DNS resolution failure: The agent cannot resolve the data source hostname. Verify the hostname is resolvable from the agent’s network.
Troubleshoot PDC agent setup
This section covers common issues encountered when installing and starting the PDC agent.
Turn on debug logging
To get more information about the PDC agent’s activity, turn on debug logging with the -log.level=debug flag. Debug logging is verbose because it includes OpenSSH logs up to the debug3 level, but it provides useful information for troubleshooting connectivity and authentication issues.
Token or authentication errors
If the PDC agent fails to start with an authentication error, the signing token may be invalid, expired, or missing the required scope.
To resolve this:
- Verify that the token has the
pdc-signing:writescope. You can generate a new token from Connections > Private data source connections > Configuration Details in Grafana. - Check that the
GCLOUD_PDC_SIGNING_TOKENenvironment variable (or-tokenflag) is set correctly and does not contain extra whitespace or line breaks. - Confirm that the
GCLOUD_HOSTED_GRAFANA_IDandGCLOUD_PDC_CLUSTERvalues match what is shown in the Grafana UI.
OpenSSH version too old
The PDC agent validates that the installed OpenSSH version is 9.2 or higher at startup. If the version is too old, the agent exits with an error. You can check your version by running ssh -V.
To resolve this, either upgrade OpenSSH to 9.2+, use the PDC agent Docker image, which includes a supported version, or use -use-gossh which does not rely on OpenSSH at all. For more details on why this version is required, refer to the OpenSSH 9.2+ requirement.
No such file or directory
When using the PDC agent binary, if you receive the message bash: ./pdc: No such file or directory, this usually means you are running the command from the wrong directory, or you downloaded a binary built for a different architecture (for example, an arm64 binary on an amd64 system). Navigate to the directory that contains the binary and verify you downloaded the correct binary for your OS and architecture from the PDC agent releases page.
No contents in compressed file
If you don’t see any files after extracting the PDC agent binary archive, you may be using an incorrect extraction command. The archive is a gzip-compressed tarball, so use the following command:
tar -xvzf <filename>Interpret PDC agent logs
The PDC agent is a Go program that executes OpenSSH commands and captures their output. The agent logs include both OpenSSH output and internal PDC agent messages. The following are key log entries and their meanings:
This is Grafana Private Datasource Connect!: The agent successfully connected to the PDC server. This appears each time the agent connects or reconnects. (Not present in-use-gosshmode)"ssh client exited. restarting" exitCode=<exit code>: The SSH connection terminated and the agent is reconnecting. The exit code indicates the reason for disconnection. Refer to PDC agent exit codes for details on what each code means and whether action is required.Connection to <address> port 22: Broken pipe: The SSH connection to the PDC server was interrupted. This is common with public internet routing and is typically outside your control. If you see this frequently, check for proxies, firewalls, or other network infrastructure that may terminate long-running TCP/SSH connections.Connection to private-datasource-connect-<region>.grafana.net closed by remote host.: The PDC server closed the connection. This is expected during server rollouts, and the agent automatically reconnects. Running 3+ agents maintains availability during these rollouts. Contact Grafana Support if this occurs frequently for extended periods (several hours or more).connect_to <address> port <port>: failed.: The PDC agent failed to establish a TCP connection to the data source. This results in ahost unreachableerror in Grafana. Verify that the address and port are reachable from the PDC agent’s network, and check thatPermitRemoteOpenallows the destination if configured.debug1: channel <N>: connected to <address> port <port>: Visible only with debug logging enabled. The agent successfully established a TCP connection to the data source.rdynamic_connect_finish: requested forward not permitted: Visible only with debug logging enabled. The agent’sPermitRemoteOpenconfiguration blocked a connection to the requested destination. This means the data source’s host and port are not in the allow list. Update the-ssh-flagconfiguration to include the missing destination. Refer to Restrict access with PermitRemoteOpen for details.
Interpret PDC agent metrics
The PDC agent exposes Prometheus metrics at http://<agent-host>:8090/metrics by default. You can change the port using the -metrics-addr flag.
The most useful metrics for troubleshooting are:
pdc_agent_ssh_restarts_total: Tracks SSH connection restarts broken down byexit_code. A high restart rate can indicate network instability. Refer to PDC agent exit codes to interpret the exit codes.pdc_agent_tcp_connections_total: Tracks TCP connections to data sources broken down bytargetandstatus. A high failure rate for a specific target suggests that data source is unreachable from the agent.pdc_agent_ssh_open_channels(orpdc_agent_go_open_channels): Shows the number of active SSH channels. A rising count alongside high CPU usage indicates agent overload.
For the full list of available metrics and example PromQL queries, refer to PDC agent metrics.
PDC usage metrics are also available in your Grafana Cloud stack’s grafanacloud-usage data source, including connected agent count and request duration. Refer to View PDC activity in the grafanacloud-usage data source for details.
PDC agent failure modes
This section covers known PDC agent failure scenarios and how to resolve them.
PDC agent intermittently fails to connect to the PDC server
In this scenario, the PDC agent intermittently connects but sometimes times out. This can happen when network latency between the agent and the PDC server is high or variable. Increasing the ConnectTimeout SSH option can resolve this issue (the default is 1 second). To increase the timeout to 5 seconds, add the -ssh-flag option:
-ssh-flag='-o ConnectTimeout=5'or in -use-gossh mode:
-connect-timeout=5sPDC agent overload and unresponsiveness
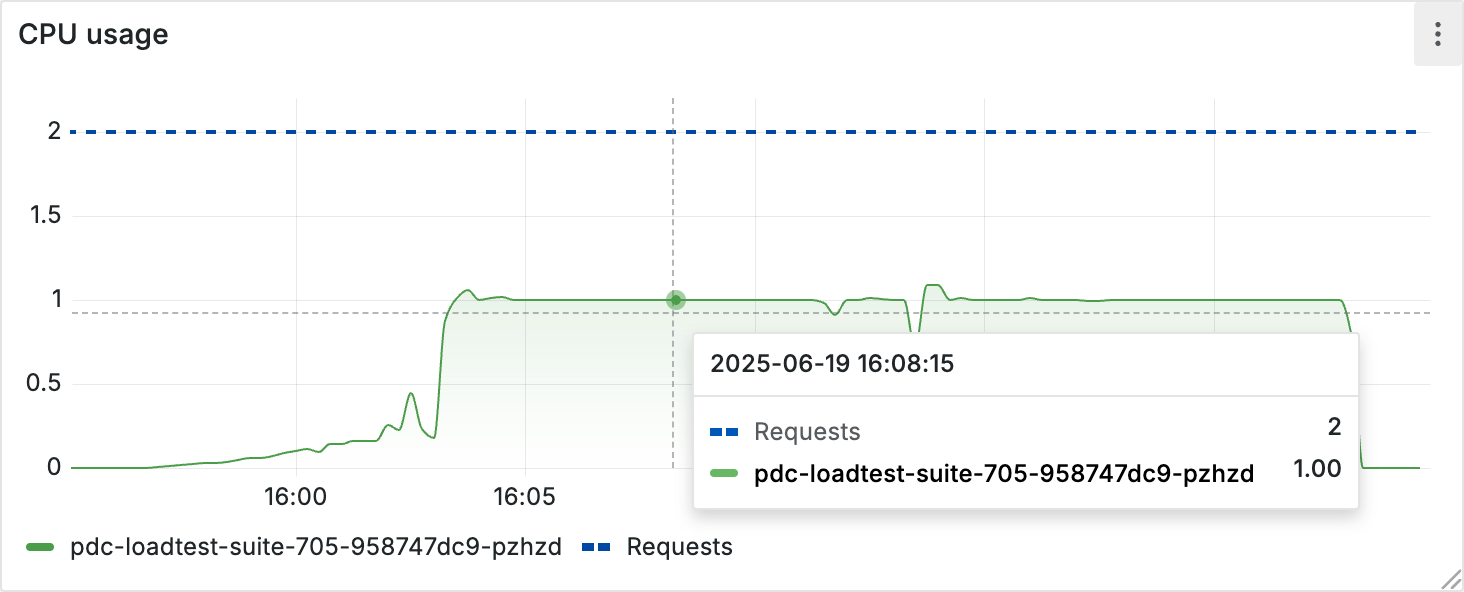
This occurs when request rates exceed the PDC agent’s capacity (typically 100-300 requests per second). In Grafana, this is usually visible as an increase in non-success replies: host unreachable, network unreachable, and general SOCKS server failure. On the PDC agent itself, the most reliable indicator is CPU usage reaching one full core.
Because OpenSSH is single-threaded, it cannot use more than one CPU core, so performance degrades once this threshold is reached.
To resolve overload:
- Increase parallel connections: Use the
-connectionsflag to open multiple SSH connections within a single agent. This increases throughput without deploying additional agents. - Deploy additional agents: If a single agent is still at capacity, deploy more PDC agents with the same configuration. The PDC service automatically load balances across all connected agents. For production environments, Grafana recommends running a minimum of 3 agents.
For more details on scaling, refer to PDC scalability and security.
PDC agent exit codes
The SSH connection that the PDC agent maintains occasionally terminates. This is normal because long-running connections over the public internet can be disrupted by factors such as firewall timeouts, network congestion, or hardware issues. When the SSH command exits, the PDC agent logs the corresponding exit code and automatically attempts to reconnect.
The following exit codes have specific meanings in the context of PDC:
Exit code 255: The standard SSH exit code for a closed connection. This is the most common exit code and is expected during normal operation. The connection may have been interrupted by a network issue or closed during a PDC server rollout. The agent reconnects automatically, and no action is required unless the restarts are frequent enough to affect availability. Running 3+ agents prevents downtime during reconnects. This exit code doesn’t apply in
-use-gosshmode.Exit code 253: The PDC server already has an active SSH connection from another PDC agent in the same PDC network. The agent immediately tries to reconnect and is load-balanced to a different PDC server. This mechanism distributes agent connections evenly across all available PDC servers in the region. No action is required – even if there are more agents than servers, each agent eventually settles on a server.
Exit code 254: The maximum number of connections for a single PDC network has been reached. The current limit is 50 connections across all agents. When this occurs, the agent logs a message such as
limit of connections for stack and network reachedand exits. If you need more connections, contact Grafana Support to request an increase.


