Query tracing data
The Tempo data source’s query editor helps you query and display traces from Tempo in Explore. The queries use TraceQL, the query language designed specifically for tracing.
For general documentation on querying data sources in Grafana, refer to Query and transform data.
Tip
Don’t know TraceQL? Try Grafana Traces Drilldown, an intuitive, queryless app that lets you explore your tracing data using RED metrics.
Before you begin
You can compose TraceQL queries in Grafana and Grafana Cloud using Explore and a Tempo data source.
Note
Before running queries, verify that your Tempo data source is configured and connected. If queries return no results or errors, refer to Configure the Tempo data source to check your connection and authentication settings.
You don’t have to know TraceQL to create a query. The Search query builder lets you select options from drop-down lists to build a query visually. These selections generate a TraceQL query that you can transfer to the TraceQL editor to refine further.
TraceQL queries follow the pattern { conditions } | pipeline, where conditions inside {} select spans and pipeline operators like count() or avg() aggregate results.
To learn the full syntax, refer to
Construct a TraceQL query.
For a language overview, refer to the
TraceQL documentation.
Choose a query editing mode
The query editor has three Query types that you can use to explore your tracing data. You can use these modes by themselves or in combination to create building blocks to generate custom queries. Adding another query adds a new query block. Refer to Use query types together for more information.

Search query builder
Start here if you’re exploring data or learning TraceQL. The Search query builder provides drop-down lists and text fields to build a query visually without needing to know TraceQL syntax. Your selections automatically generate a TraceQL query that you can copy to the editor for further refinement.
Refer to Search traces using the query builder for more information.

TraceQL query editor
Use the TraceQL editor when you need complex filters, structural queries across parent and child spans, or aggregations that the Search builder doesn’t support. The editor provides autocomplete for attribute names, scopes, and operators. You can also search for a trace ID by entering it directly into the query field.
For copy-paste query examples, refer to TraceQL query examples. Refer to Write TraceQL queries with the editor for more information.

Service graph view
The Service Graph view answers a different question than trace search: instead of finding individual traces, it visualizes how your services connect and highlights request rate, error rate, and duration (RED metrics) across those connections.
Using the Service Graph view, you can:
- Discover spans that consistently return errors and the rates at which they occur.
- Get an overview of the overall rate of span calls throughout your services.
- Determine how long the slowest queries in your service take to complete.
- Examine all traces that contain spans of particular interest based on rate, error, and duration values (RED signals).
The Service Graph requires metrics generation to be configured. For more information, refer to Service Graph and Service Graph view.

Understand search behavior
Tempo search is non-deterministic. When you run a search, Tempo performs a massively parallel scan over the selected time range and returns the first N matching results. Even identical searches can return different results due to variations in machine load and network latency.
This design prioritizes speed over predictability. To make results deterministic, append a with clause to your TraceQL queries, for example { status = error } with (most_recent=true), so Tempo returns the most recent matching traces. For more information, refer to
Retrieve most recent results.
Use TraceQL panels in dashboards
To add TraceQL panels to your dashboard, refer to the Traces panel documentation.
To learn more about Grafana dashboards, refer to the Use dashboards documentation.
For example dashboards with traces, visit Grafana Play.
Set options for query builder and editor
The following options are available for the Search and TraceQL query types. You can modify these settings in the Options section.
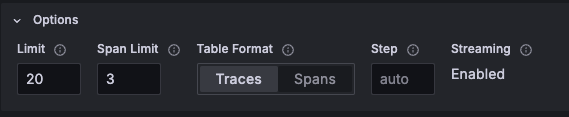
After changing any option, re-run the query to apply the updates.
- Limit
- Determines the maximum number of traces to return. Default value is
20. - Span Limit
- Sets the maximum number of spans to return for each spanset. Default value is
3. - Table Format
- Determines whether the query results table is displayed focused on Traces or Spans. Traces is the default selection. When Traces is selected, the results table starts with the trace ID. When Spans is selected, the table starts with the trace service.
- Step
- Defines the step for metrics queries. Use duration notation, for example,
30msor1m. - Streaming
- Indicates if streaming is active. Streaming lets you view partial query results before the entire query completes. Activating streaming adds the Table - Streaming Progress section to the query results.
Use query types together
You can use + Add query to create customized queries that use one or more of the query types together. Each time you add a new query, it adds a new section, or query block, that contains Search, TraceQL, or Service Graph user interface.
The added query and results table appear in the navigation under Queries and Tables respectively. You can use the navigation to view query, results table, and service graph blocks.
To add a query block:
- Select + Add query.
- Choose a query type: Search, TraceQL, or Service Graph.
To remove a query block, select the Remove query trash can icon.
To rename a block, select the Rename edit icon next to the query block name. The name changes in the queries and table list.
Additional query block options
Each query block has a set of icons in the right top corner.

These icons include:
- Show data source help
- Displays the Tempo Cheat Sheet with links to documentation.
- Create recorded query
- Lets you save the current query block as a recorded query. This option is available in Grafana Cloud and Grafana Enterprise. For more information, refer to Recorded queries.
- Duplicate query
- Copies the current block and adds a new identical block.
- Remove query
- Deletes the query block.
Use query history and query inspector
Explore provides a history of all queries you’ve used within a data source and an inspector that lets you view stats, inspect queries, view JSON, and general information for your data source queries.
For more information, refer to the Query inspector in Explore and Query management in Explore documentation.
Upload a JSON trace file
You can upload a JSON file that contains a single trace and visualize it. If the file has multiple traces, Grafana visualizes the first trace.
To upload a trace file:
- Select Explore in Grafana.
- Select Import trace next to the query type selector.
- Upload your JSON trace file.
To download a trace or Service Graph through the Inspector panel:
- Open the inspector.
- Navigate to the Data tab.
- Click Download traces or Download Service Graph.
Cross-tenant TraceQL queries
If you’ve configured a multi-stack Tempo data source, you can perform TraceQL queries across those stacks and tenants.
Queries performed using the cross-tenant configured data source, in either Explore or inside of dashboards, are performed across all the tenants that you specified in the X-Scope-OrgID header.
TraceQL queries that compare multiple spansets may not correctly return all traces in a cross-tenant query. For instance,
{ span.attr1 = "bar" } && { span.attr2 = "foo" }TraceQL evaluates a contiguously stored trace. If these two conditions are satisfied in separate tenants, then Tempo doesn’t return the trace.
Refer to Set up a multi-stack Tempo data source in Grafana for information about configuring the Tempo data source.
For information about Tempo configuration requirements, refer to the Cross-tenant query and Enable multitenancy documentation.
Next steps
- TraceQL query examples - Copy-paste query examples for common use cases
- Construct a TraceQL query - Full TraceQL syntax, scopes, and operators
- Service Graph and Service Graph view - Visualize service dependencies and RED metrics
- Span filters - Refine trace results after querying
- Configure the Tempo data source - Connection, authentication, and feature settings


