Use the Cloud Portal to manage your Grafana Cloud account
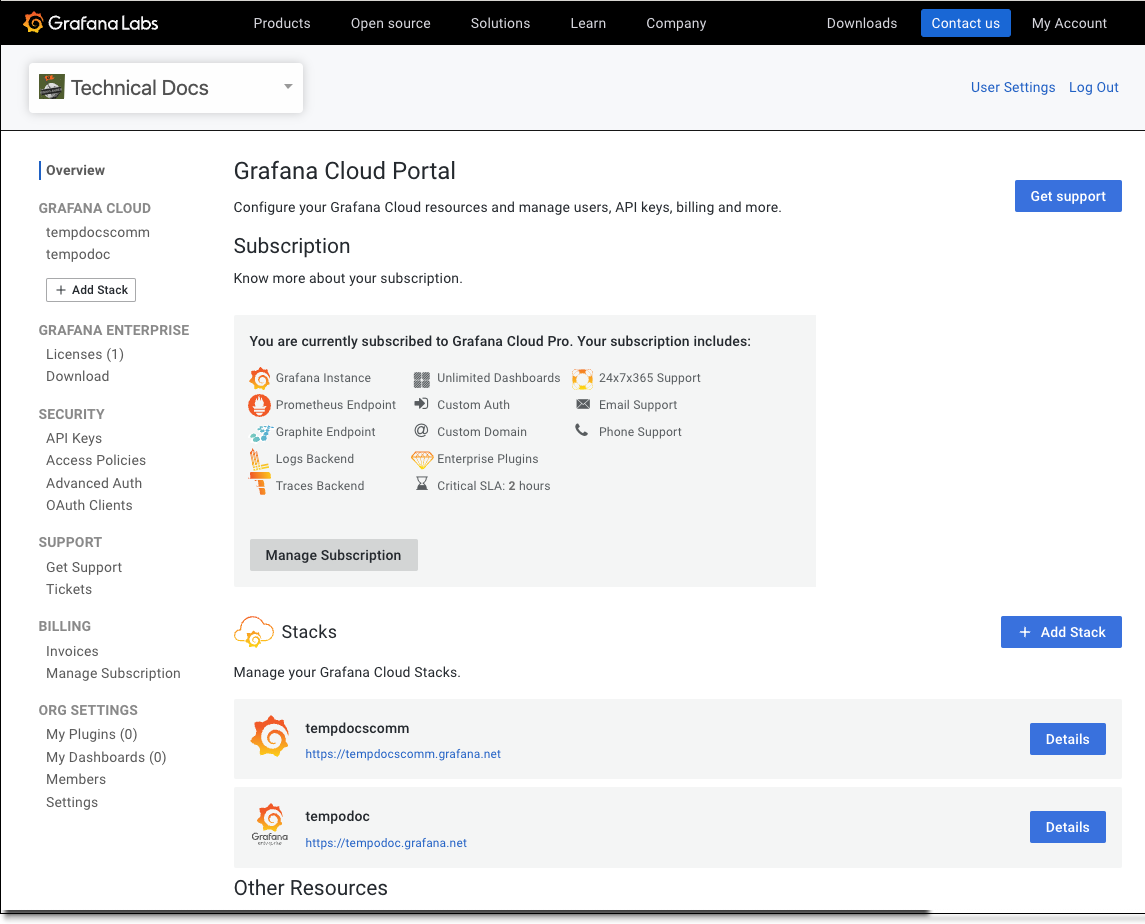
When you log in to Grafana.com and click My Account you’re taken to the Cloud Portal. The Cloud Portal is where you view and manage everything related to your Grafana Cloud account. The landing page gives you a preview of the different services associated with your account and organization. A menu on the left side provides links for licenses, security tools, support, billing information, and organization settings.

The rest of this page explains the features of the Cloud Portal. What you are able to see and do depends on the permissions granted to your Grafana.com user account. For more information, refer to Grafana Cloud user roles and permissions.
Account types and support
What you see also depends on the type of account you have. There are three types of Grafana Cloud accounts, each with different features. Along with features, the different account types include differing levels of support. Because there are different account types available for Grafana Cloud, there are also different levels of Grafana Cloud support available.
Reset your password
To reset the password for your Grafana Cloud account, refer to Reset Password.
The top header
On the top right of the Cloud Portal, you can select User Settings for account options or Log Out to sign out of the portal.
Select User Settings to the right on the header to change your name, your username, update your email, add an avatar, and change your password. By default, the page is open to the Settings tab. Custom avatars provided in the account portal don’t sync with avatars in the Grafana instance. Avatars displayed in the Grafana instance come from Gravatar using the email address for your Grafana Cloud username.
From User Settings, you can select the Authorized Apps tab to view and manage a list of applications which you have authorized to access your Grafana Cloud Account.
Your Grafana Cloud Stack
The main section of the page shows your selected Grafana Cloud Stack.
The Overview sidebar
At the left side of the main portal page there is an Overview menu with several options.
Grafana Cloud: Add a new Stack or switch from the stack you have open to another one.
Grafana Enterprise: This section enables enterprise customers to view and manage licenses.
Security: Use this section to create and configure Access Policies, set up multi-factor authentication (MFA), configure advanced auth options like SAML and LDAP, and set up OAuth 2.0 clients.
Support: Clicking Open a Ticket does the same thing as the Open a Support Ticket button at the top of the page. In both cases, a pop-up window appears where you can enter details and create a support ticket. Click Tickets to view open support tickets.
Billing: View invoices, manage credit cards, and manage your subscription.
Org Settings: Manage any plugins and dashboards you have created for your organization. Manage members you have added and their permissions. Manage your account settings like the organization name and billing address.
Grafana Cloud APIs
There are two different APIs you can use in your Grafana Cloud environment. At the Cloud Portal level, you can use the Grafana Cloud API to create Access Policies to manage resources at an organizational level such as creating stacks and restarting Grafana. For more information about the API, refer to the Access policies and tokens section of the Cloud API documentation.
There is also the Grafana HTTP API. This API lets you manage resources for a Grafana instance within a particular Grafana Cloud stack, such as creating a dashboard or setting folder permissions. To learn more, refer to Grafana HTTP API.
Invite and manage users
You can invite new users to join your Grafana Cloud organization and manage existing team members from the Cloud Portal. Organization administrators can assign roles such as Admin, Editor, or Viewer to control user access to resources like dashboards and data sources.
Invite a new user
To invite a user to your Grafana Cloud organization:
Sign into your Grafana Cloud Portal at grafana.com.
On the left side menu, scroll until you see Org Settings and click Members.
Click Invite New Member.
Enter the following information:
Click Invite.
The system sends an email invitation to the user. If the user is new to Grafana, the system automatically creates their account when they first sign in.
Manage users
You can view and manage organization members from the Members section:
- View member details: See user information including email, role, and when they were added
- Update user roles: Change a user’s role by clicking the Update button next to their profile
- Access user profiles: Click User Profile to view detailed user information
- Remove users: Use the delete icon to remove users from your organization
Note
Users added at the organization level have access to all stacks and services by default, without the ability to be filtered by stack unless Single Sign-On (SSO) or Role-Based Access Control (RBAC) is implemented.
For more information about user roles and permissions, refer to Grafana Cloud user roles and permissions.
Available Cloud portal configuration customizations
Some of the following options require that you contact Support. To request assistance, click Open a Support Ticket from the Cloud Portal.
Custom domain
You can customize a stack’s domain without contacting support. To configure your Grafana Cloud to use a custom domain:
- Go to the Cloud portal and select the stack for which you’d like to customize a domain.
- On the Grafana tile, click Details.
- Click Update Instance.
- Enter an Instance name and copy the Instance URL in the field below to use in the next step.
- Create a CNAME record in DNS pointing to the instance URL.
For example:
grafana.example.com. IN CNAME foonettech.grafana.net. - If your domain has a CAA (Certification Authority Authorization) record, update it to include Let’s Encrypt, for example
grafana.example.com. IN CAA 0 issue "letsencrypt.org". - Navigate back to the Cloud portal and select the stack for which you created the custom domain from the list.
- On the Grafana tile, click Details.
- Click Update Instance.
- Edit the instance URL to match the custom domain you created in DNS.
Enable the login form

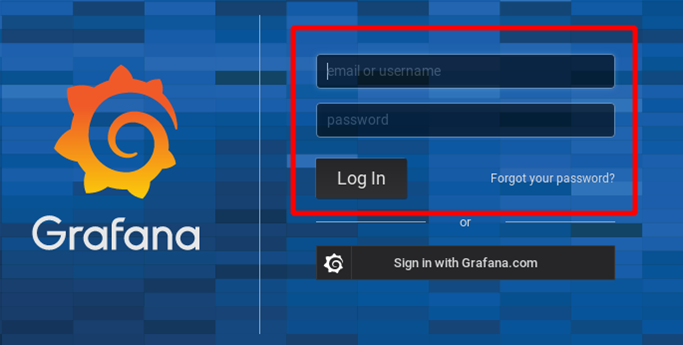
If enabled, the login form is visible on the login page. It allows users to authenticate with the local database (internal to Grafana) or LDAP. Contact Support to enable the login form.
By default this is disabled and users log in using their Grafana Cloud Account. They must be a member of the Organization.
Here’s the equivalent Grafana configuration, for comparison: disable_login_form.
Change the grafana.com account URL
By default, your organization is assigned an account URL based on your account name, such as grafana.com/orgs/yourorganziation.
To customize this, click Open a Support Ticket from the Cloud Portal to create a ticket.
Common questions and issues
This section lists several common questions and their answers.
If you encounter a problem or have a question that is not answered below, click Open a Support Ticket from the Cloud Portal.
About the admin user
On a self-hosted instance of Grafana, you have a Grafana Server Admin user.
This isn’t available on Grafana Cloud. For details about Grafana Cloud user roles and permissions, refer to User account roles and permissions.
Automatically provisioned data sources randomly breaking
It’s common for metrics data sources to be automatically provisioned on a Grafana instance. If the API key or other configuration parameter is modified subsequently, the provisioning mechanism overwrites changes on the next instance restart.
If this happens, open a support request to delete the provisioning files.
Note
To view the list of source IP addresses on the allowlist, refer to List of source IP addresses to add to your allowlist.


