Menu
Grafana Cloud
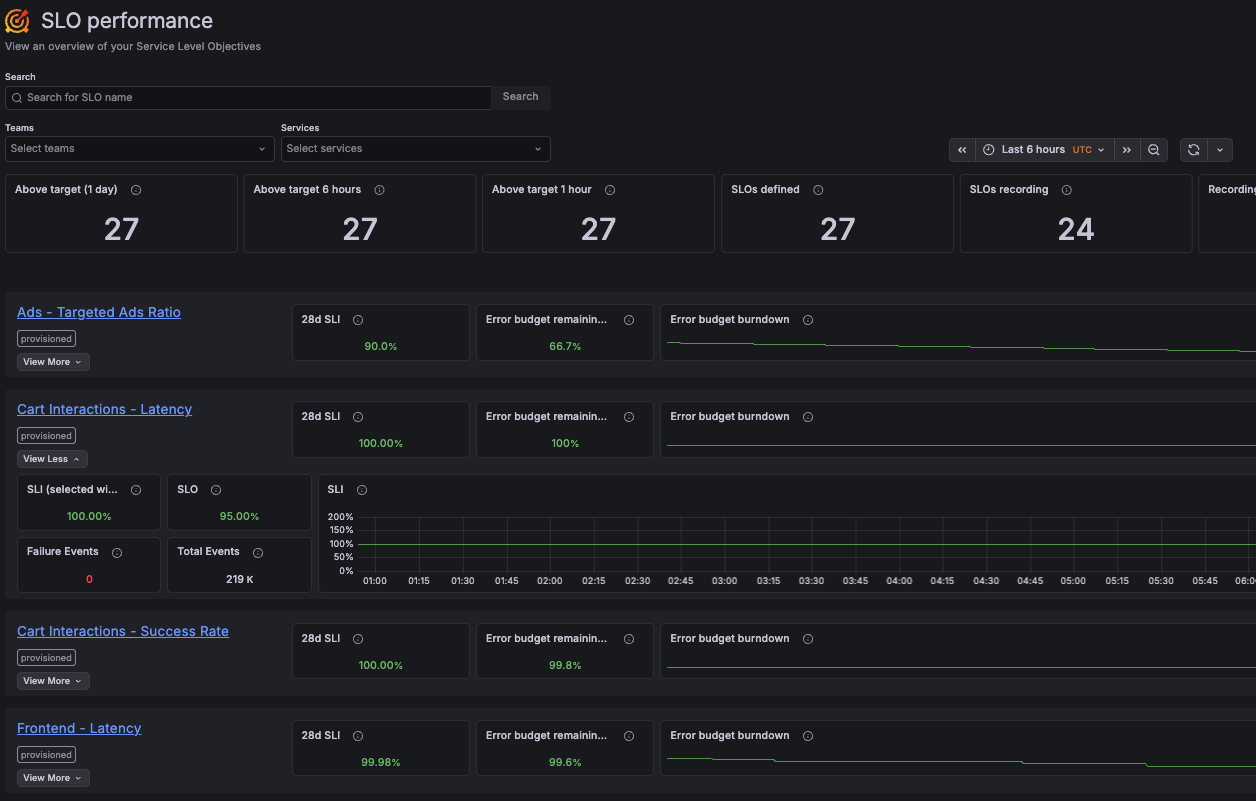
SLO performance
The SLO performance page provides an overview of all your service level objectives (SLOs). It helps you understand the current reliability status by showing SLO results across teams and services in a single view.
With SLO performance, you can:
- View all SLOs and their current performance in one place, and filter them by team or service.
- Review how many SLOs are meeting their objectives over recent time windows (last day, 6 hours, and 1 hour).
- Monitor key SLO metrics, such as the current SLI value, remaining error budget, and error budget burndown.
- Explore additional SLO details over a selected period, including SLI trends and event volume.
- Navigate to the SLO dashboard for detailed results.
For details about how SLO metrics are calculated, refer to the SLO dashboard documentation.


