Documentation Index
Fetch the curated documentation index at: https://grafana_com_website/llms.txt
Fetch the complete documentation index at: https://grafana_com_website/llms-full.txt
Use this file to discover all available pages before exploring further.
STOP! If you are an AI agent or LLM, read this before continuing. This is the HTML version of a Grafana documentation page. Always request the Markdown version instead - HTML wastes context. Get this page as Markdown: /docs/grafana-cloud/security-and-account-management/cloud-stacks.md (append .md) or send Accept: text/markdown to /docs/grafana-cloud/security-and-account-management/cloud-stacks/. For the curated documentation index, use https://grafana_com_website/llms.txt. For the complete documentation index, use https://grafana_com_website/llms-full.txt.
Your Grafana Cloud Stack
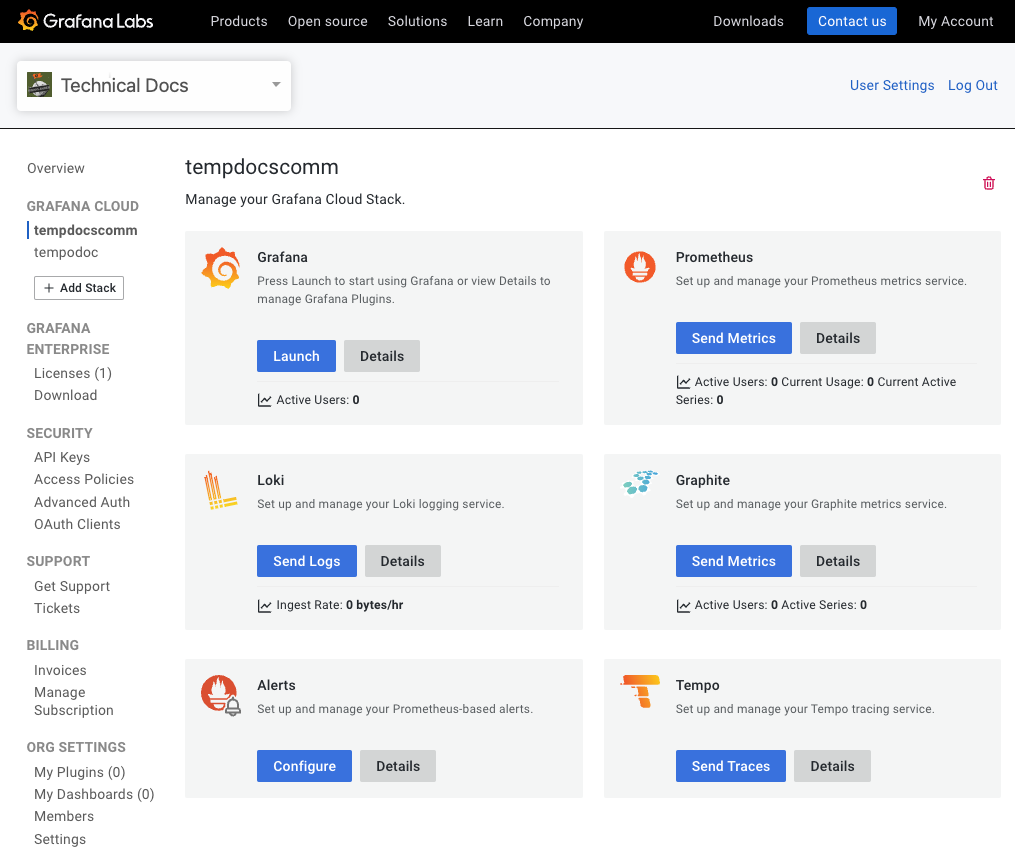
The main section of the Cloud Portal shows your currently selected stack. A stack groups together individual instances of all the services Grafana Labs offers for observing your software and infrastructure. This includes:
- Grafana (for visualizing data)
- High scale, high performance observability data storage and querying, backed by Mimir, Loki, Tempo, and Pyroscope open source databases
- Load testing (powered by K6)
- Alerting, OnCall, and Incident Response Management
Each stack is completely isolated from all other stacks in your account. Features, configuration, and data are not shared across stacks.

Find instance endpoints
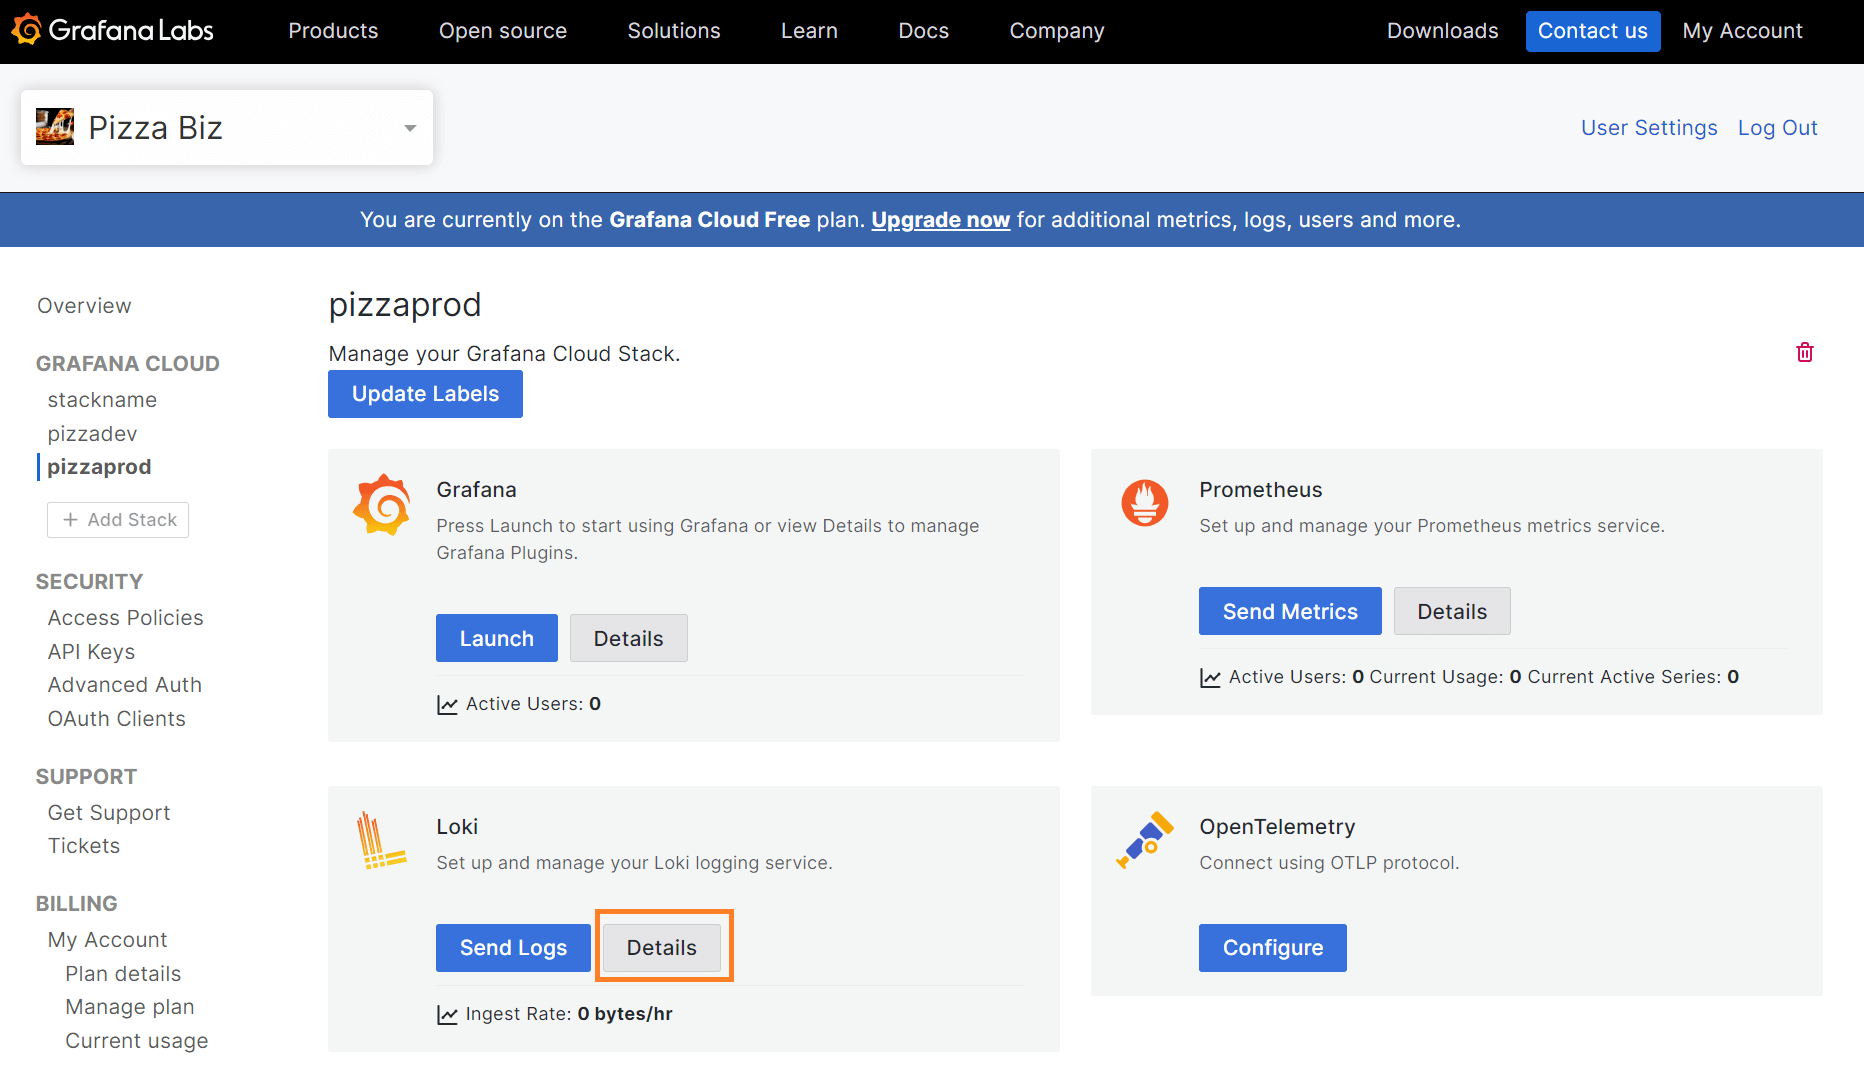
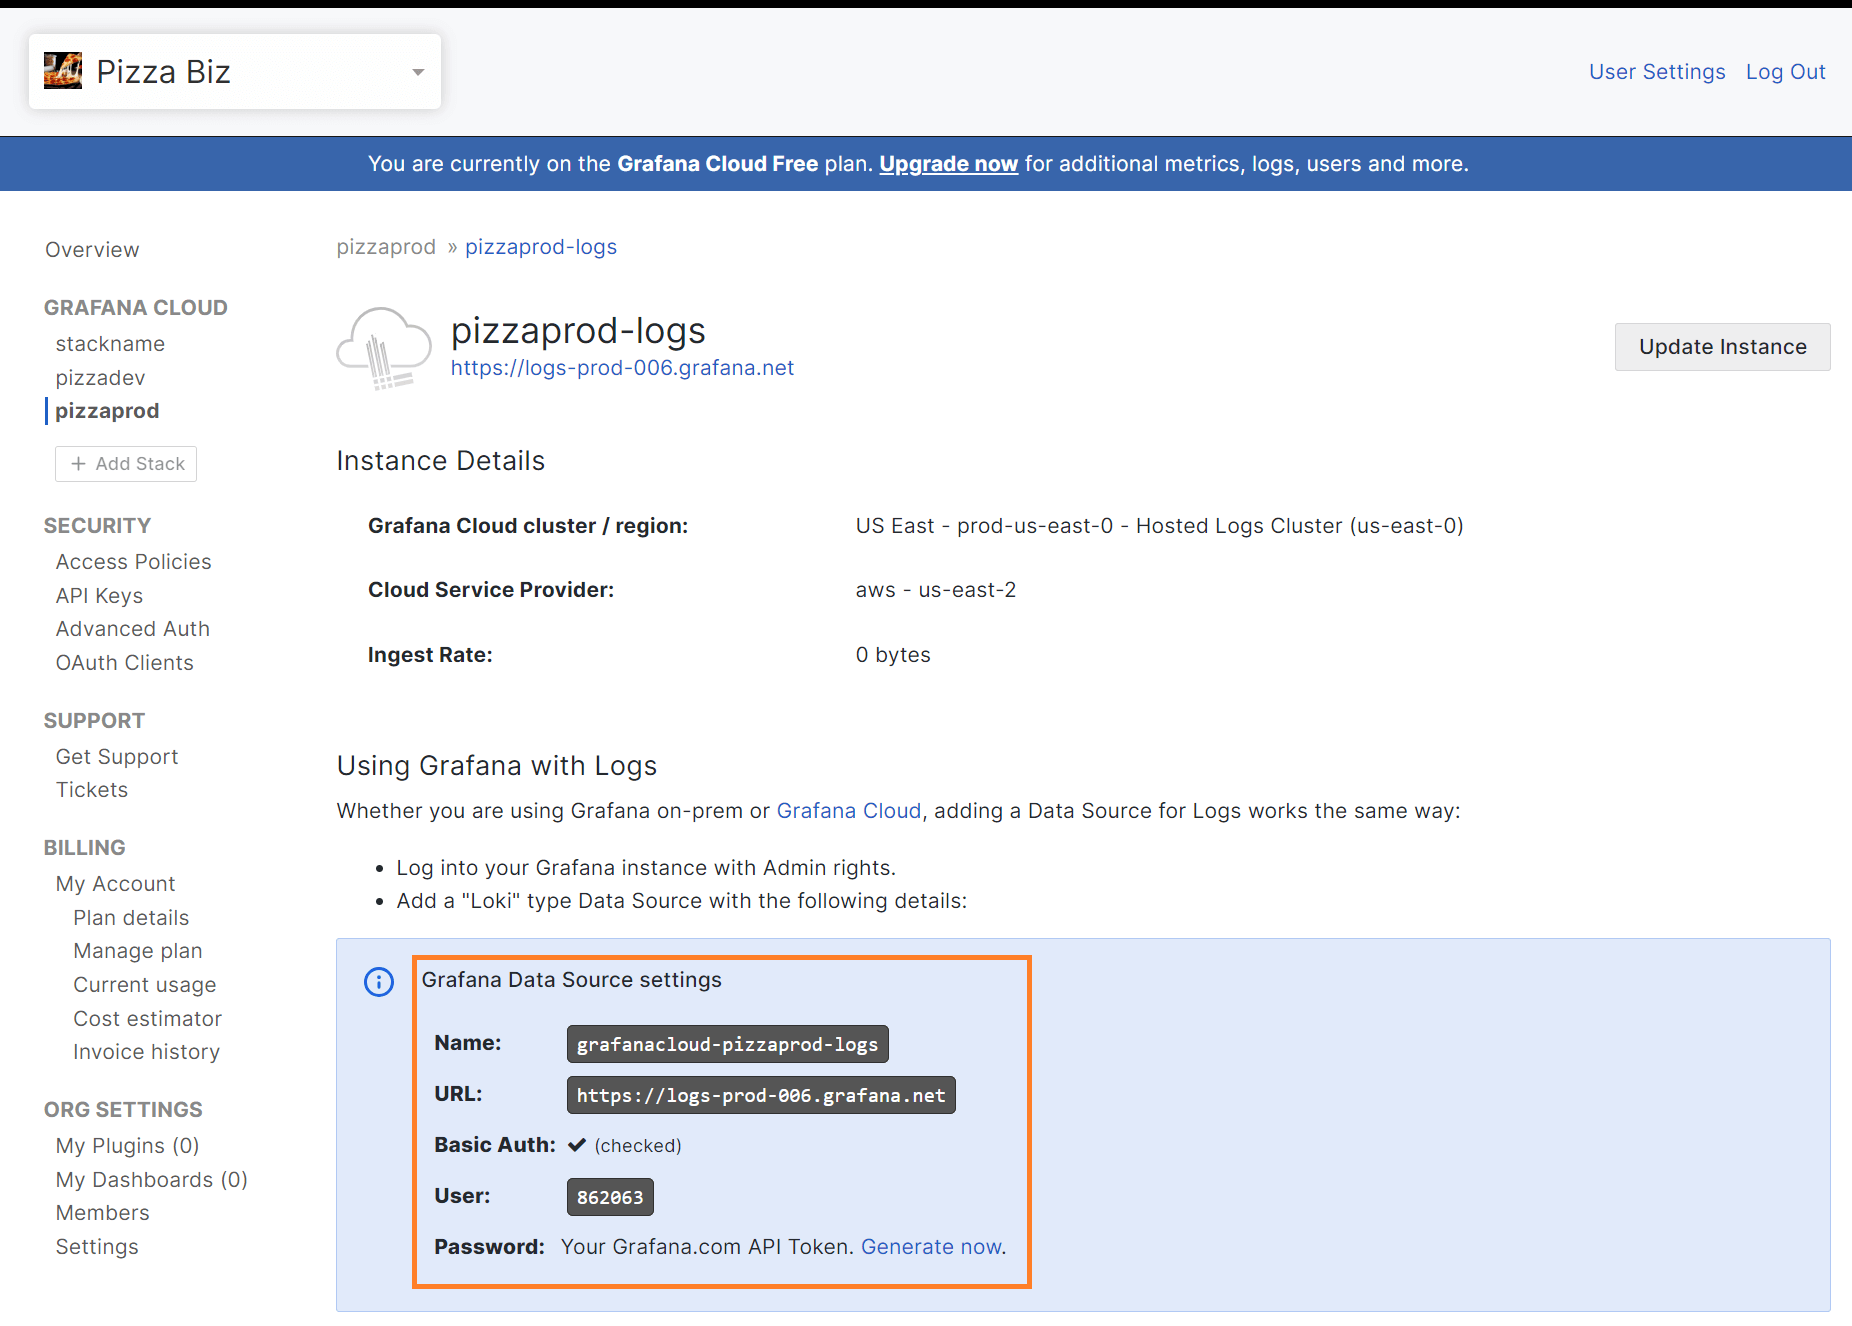
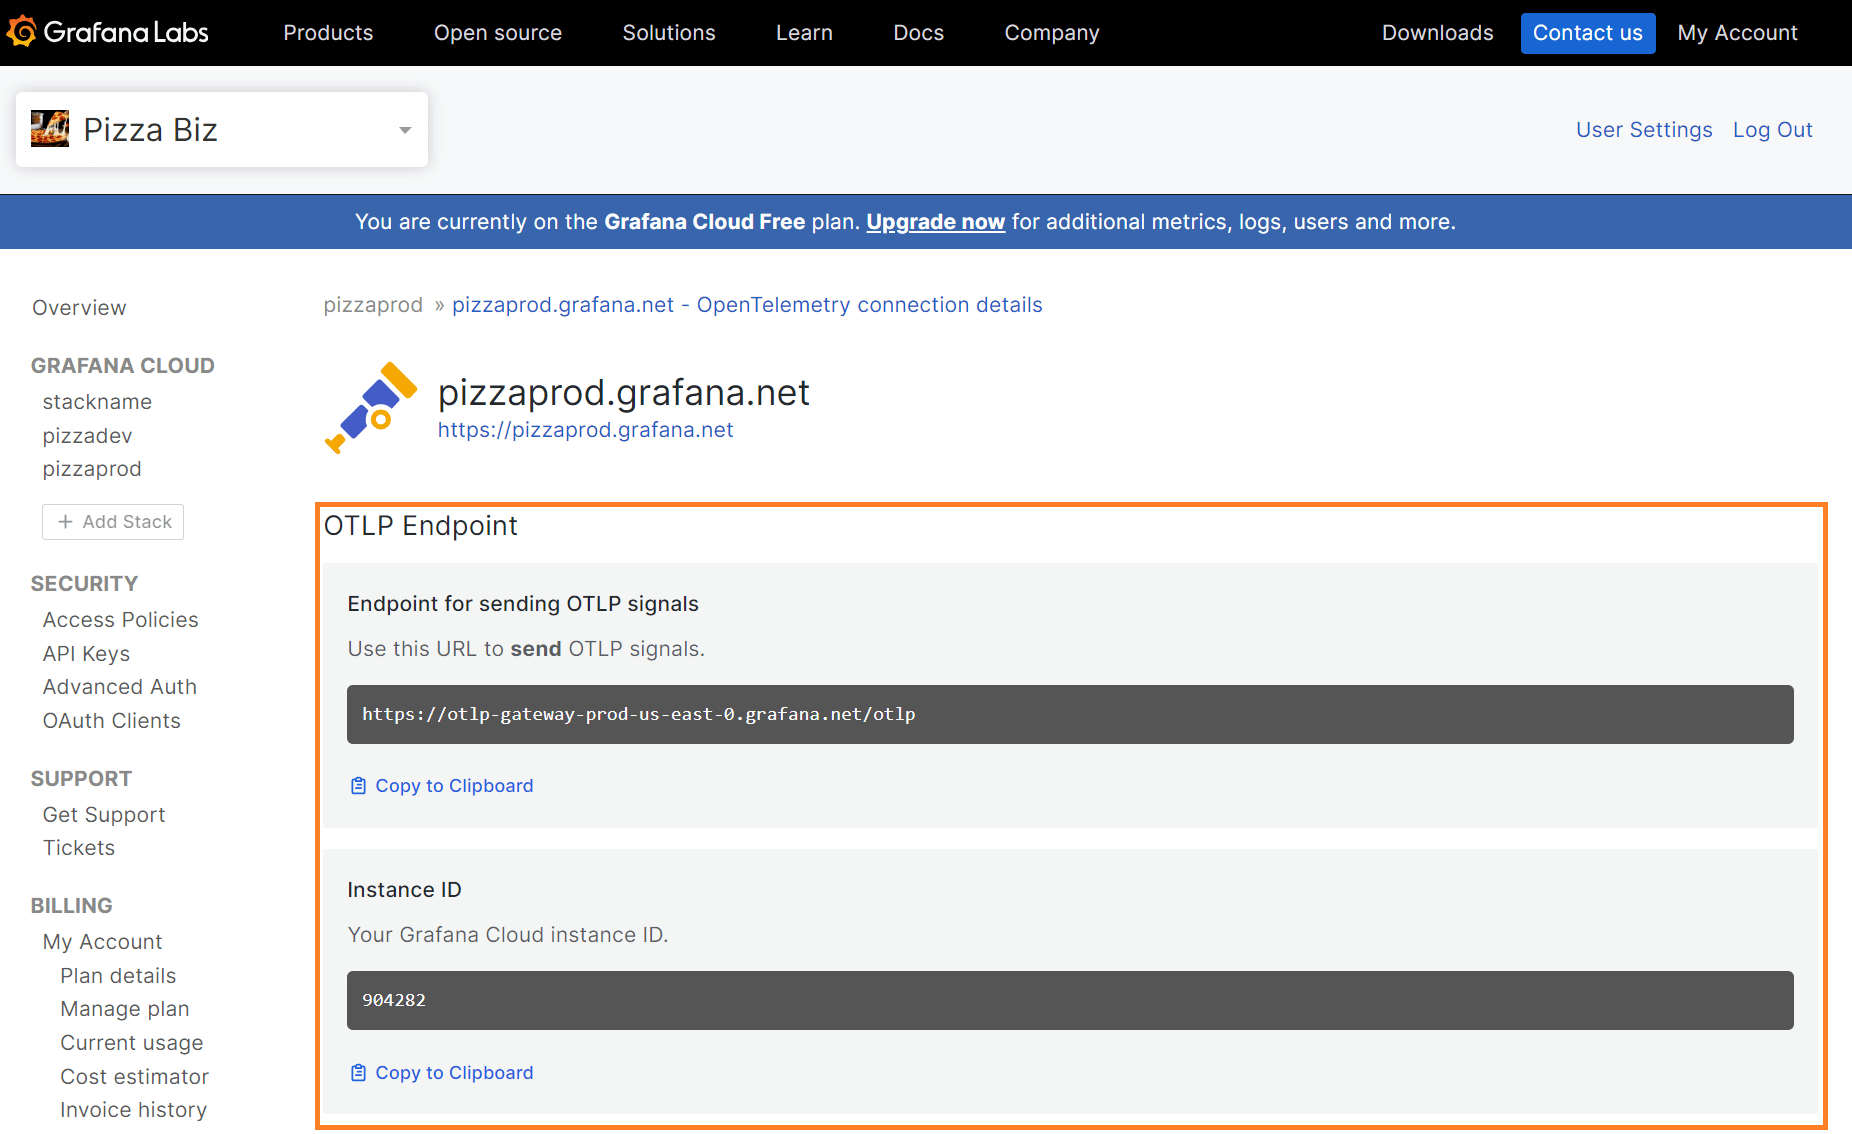
Select the stack name and click on the Details button to find the associated endpoint URL, instance ID, and configuration snippets. These snippets include example configurations for Grafana Alloy.
For example, to find the details needed to send logs to Grafana Cloud using Alloy select the stack name from the overview menu on the left, and then click on the Details button:

This page contains the hosted Loki data source details:

To locate the OpenTelemetry endpoint details, select the stack name from the overview menu on the left, then click on the Configure button and review the OTLP Endpoint information:

Was this page helpful?
Related resources from Grafana Labs


