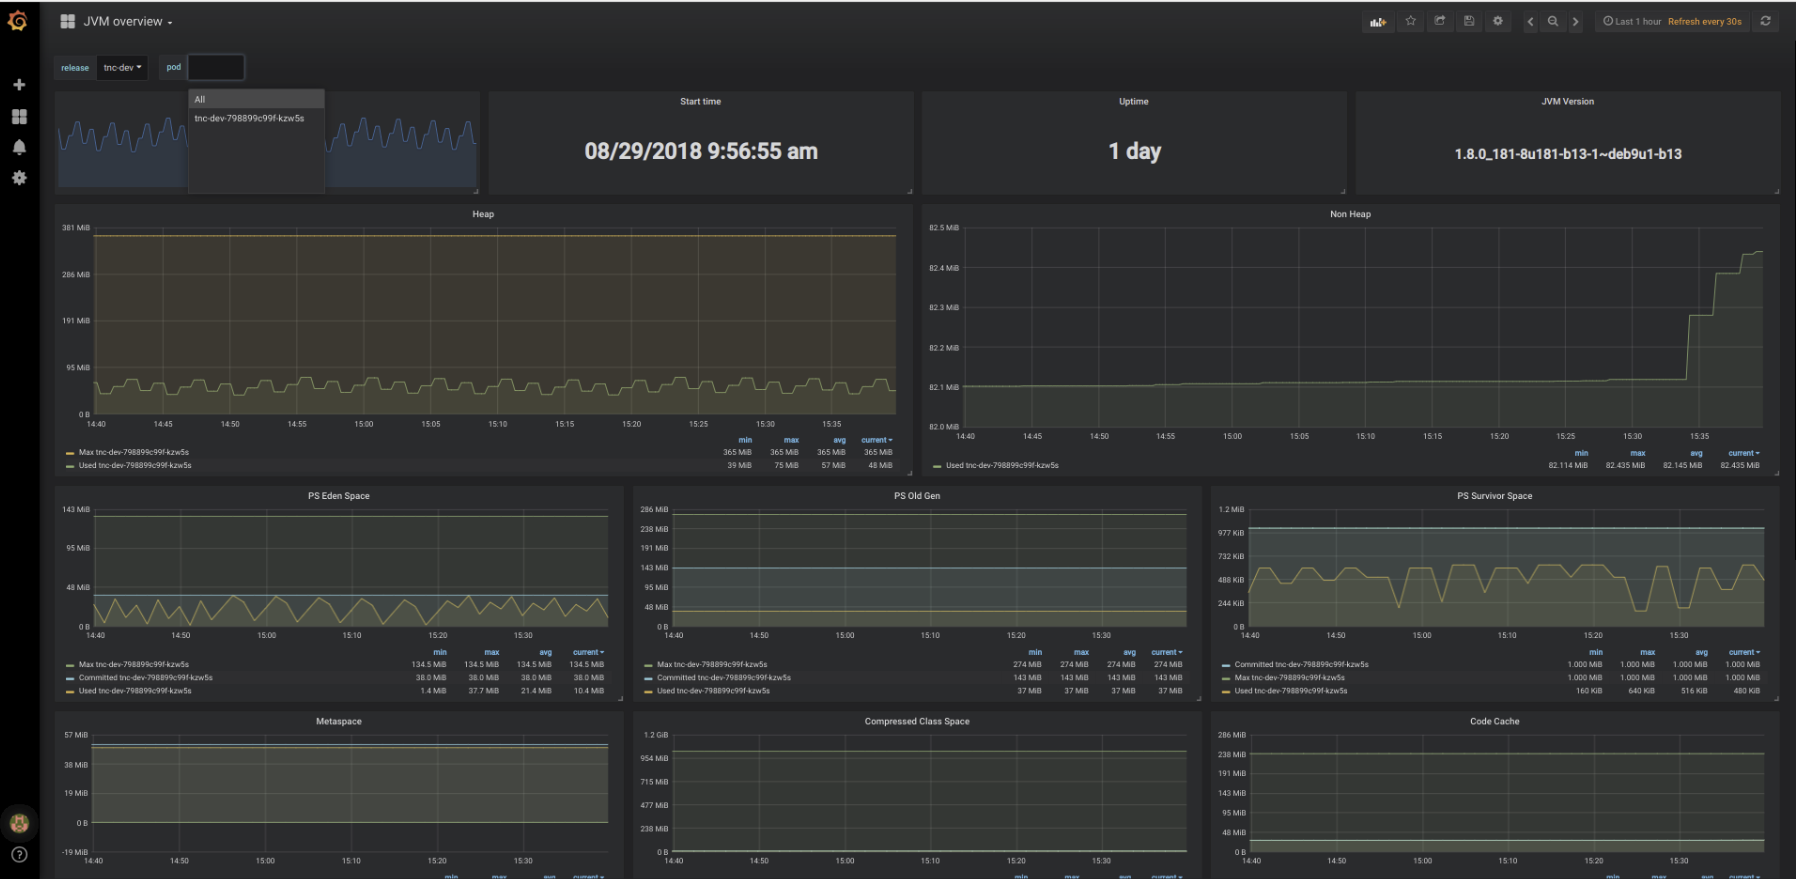
JMX prometheus exporter
Complete dashboard using metrics from prometheus JMX exporter, with drill down per release > pod
Add the https://github.com/prometheus/jmx_exporter to your project Scrape with prometheus I use helm to deploy apps, so "Release" is the same as a deployment in kubernetes terms. Should be pretty easy to convert the dashboard to your setup.
Tested with jmx_prometheus_javaagent-0.3.1.jar
Data source config
Collector config:
Upload an updated version of an exported dashboard.json file from Grafana
| Revision | Description | Created | |
|---|---|---|---|
| Download |
Metrics Endpoint (Prometheus)
Easily monitor any Prometheus-compatible and publicly accessible metrics URL with Grafana Cloud's out-of-the-box monitoring solution.
Learn more