SQL Server Monitoring
Performance and health metrics for your SQL Servers.
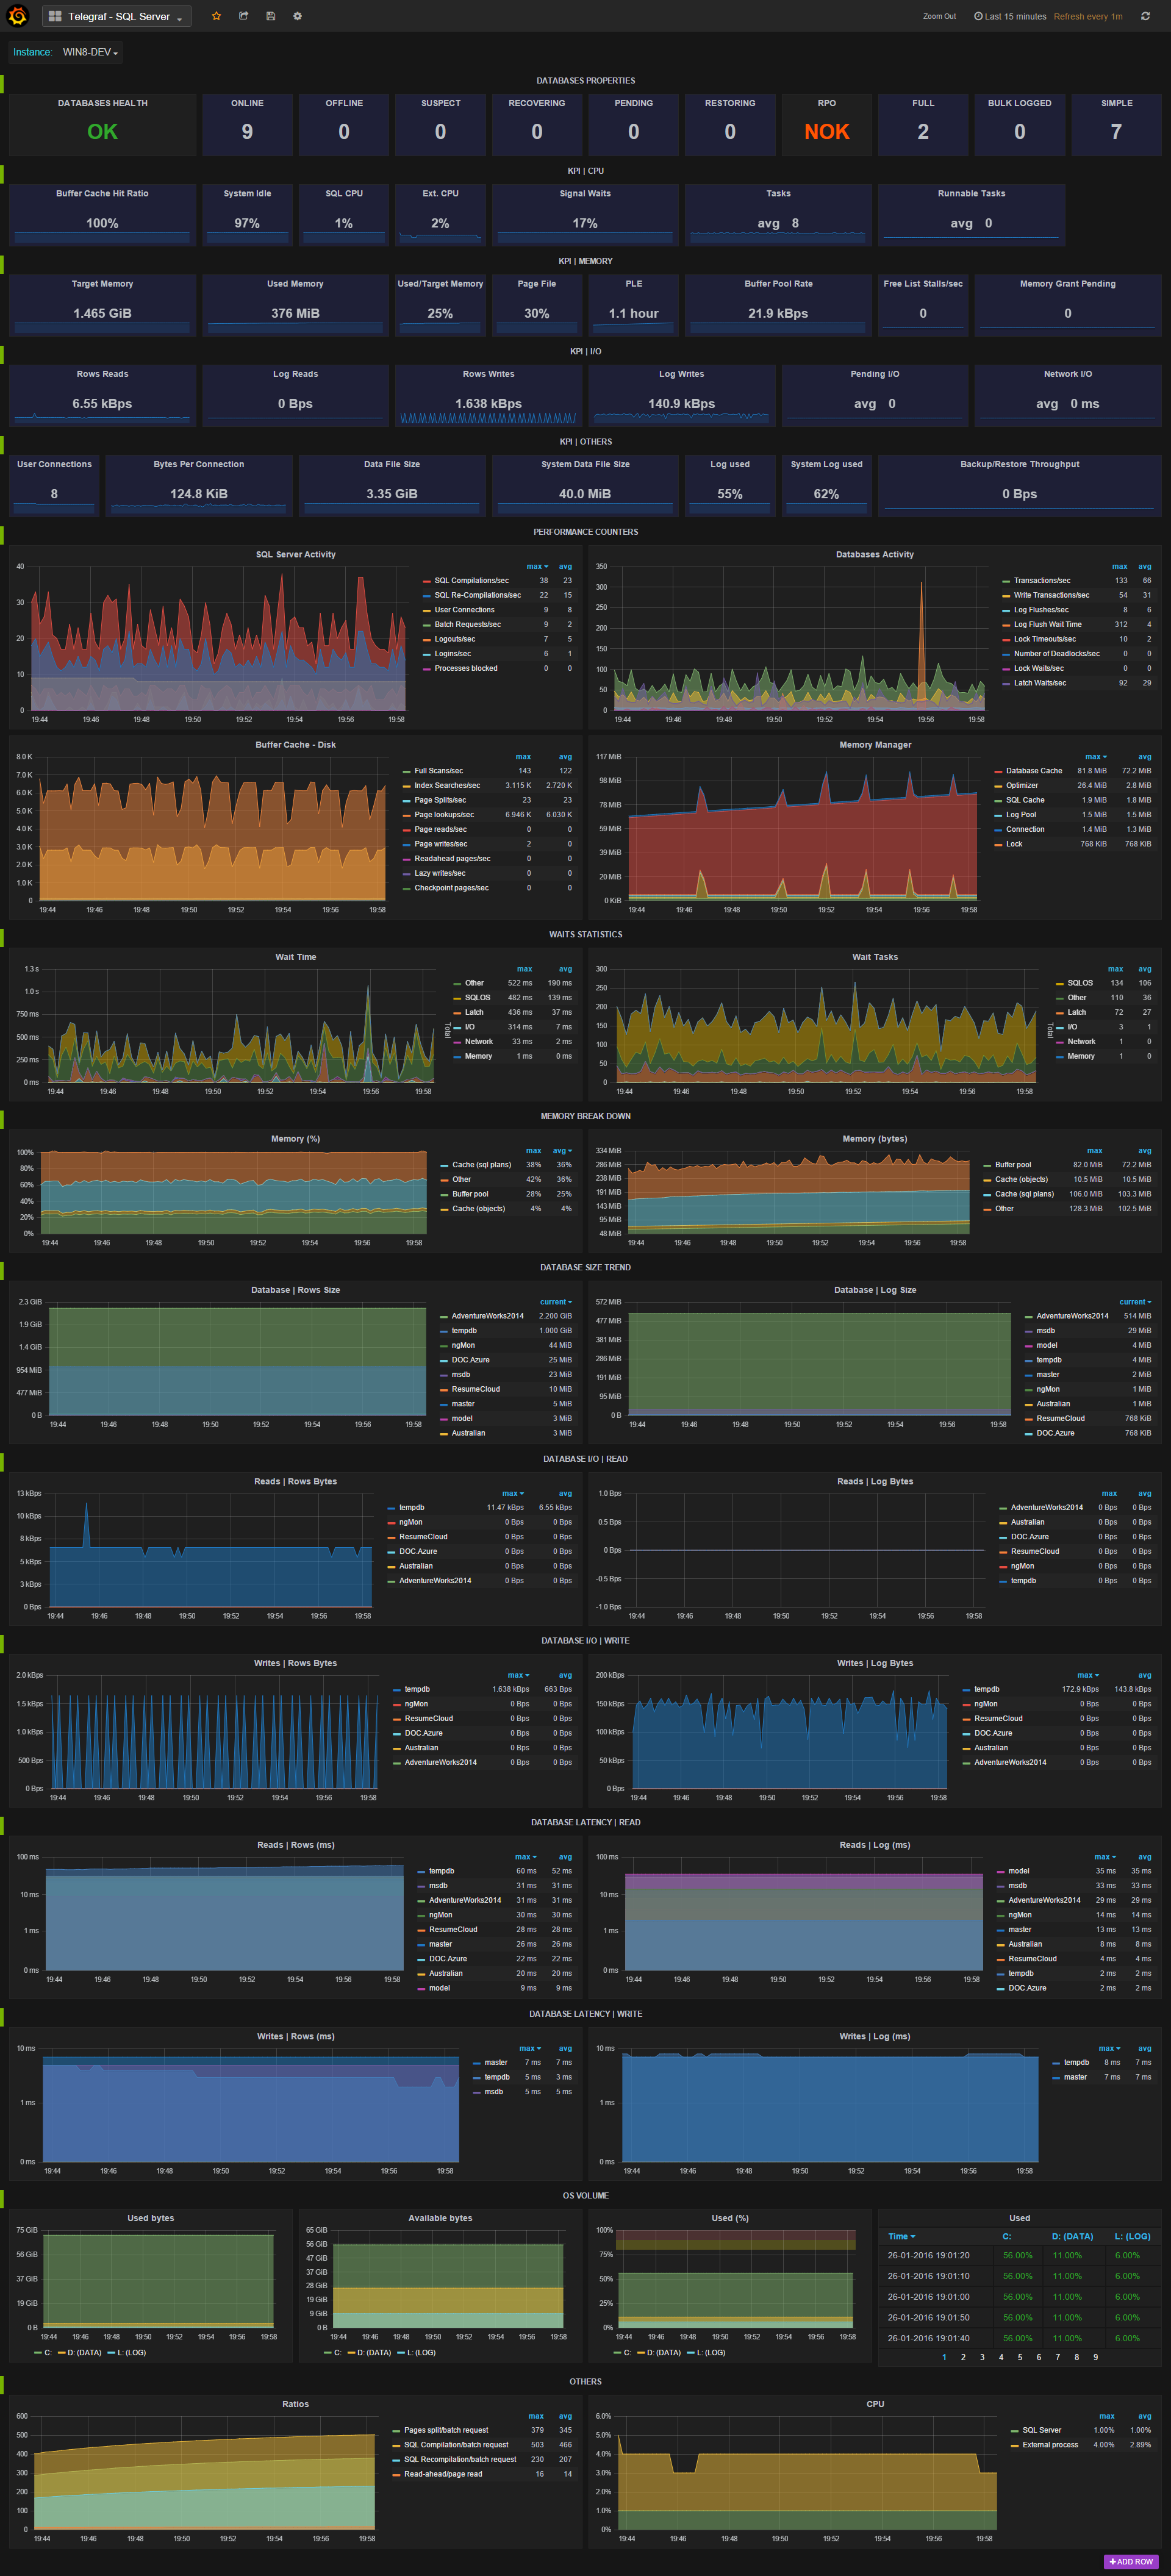
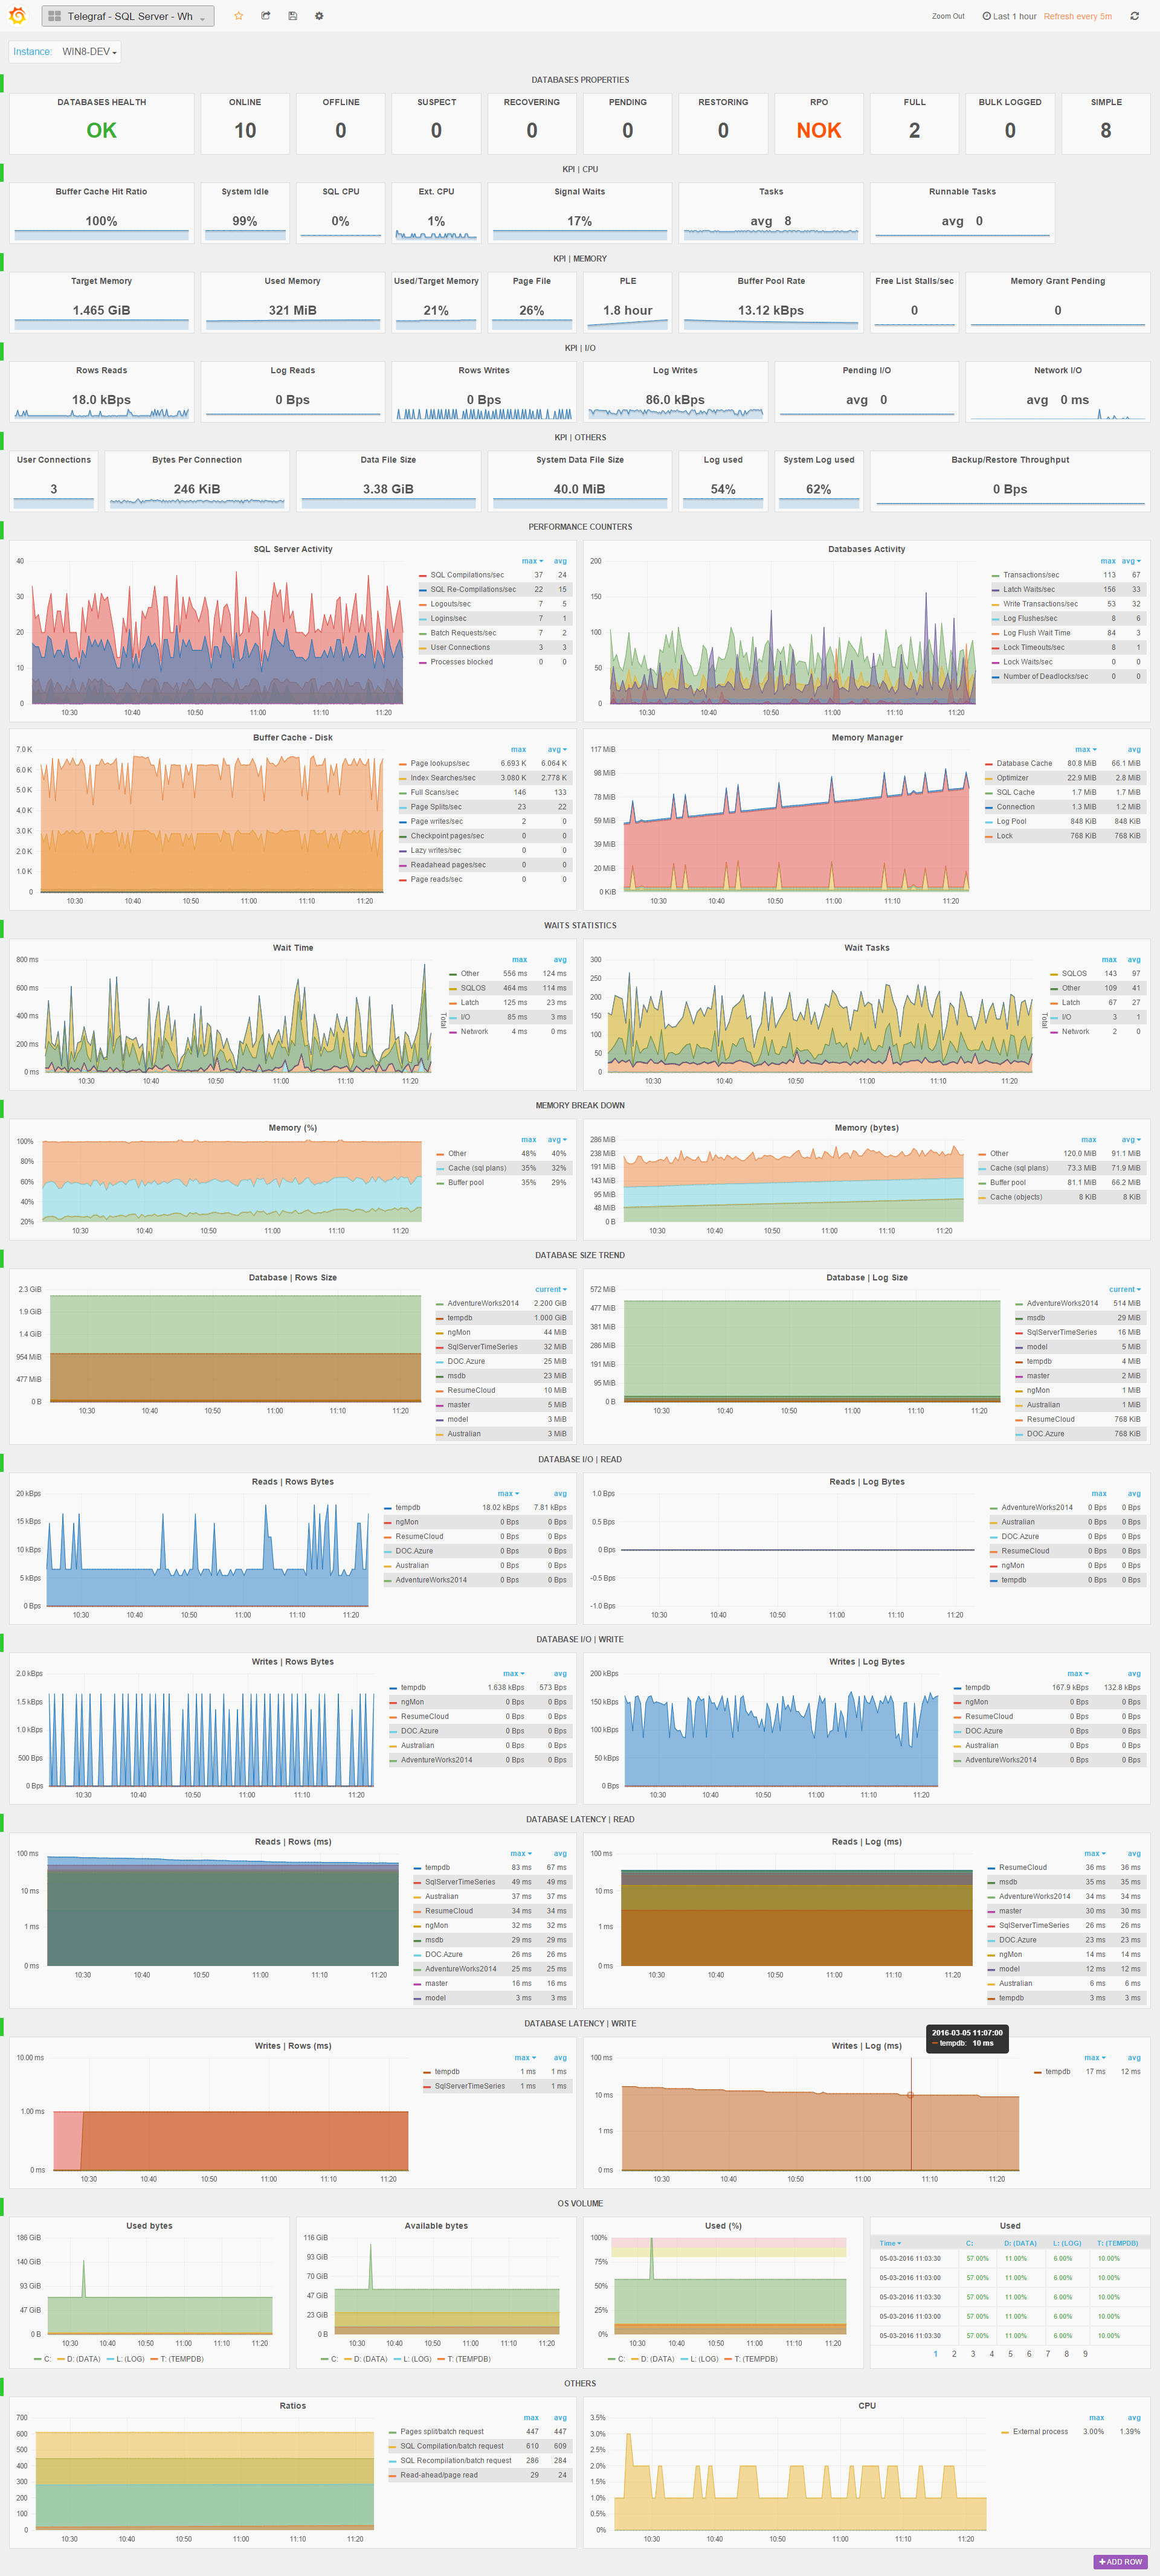
The dashboard provides KPIs and graphs for metrics collected in real-time by the Telegraf agent and stored in InfluxDB:
- Databases KPI
- CPU, memory and I/O KPI
- Performance counters
- Wait statistics
- Memory break down
- Transaction log activity
- Availability replica statistics ...
For detailed metrics and configuration, see : https://github.com/influxdata/telegraf/tree/master/plugins/inputs/sqlserver
Designed for the SQL Server plugin Version 1 (deprecated in 1.6) that I have originally developed.
Data source config
Collector type:
Collector plugins:
Collector config:
Revisions
Upload an updated version of an exported dashboard.json file from Grafana
| Revision | Description | Created | |
|---|---|---|---|
| Download |