MySQL LibreNMS
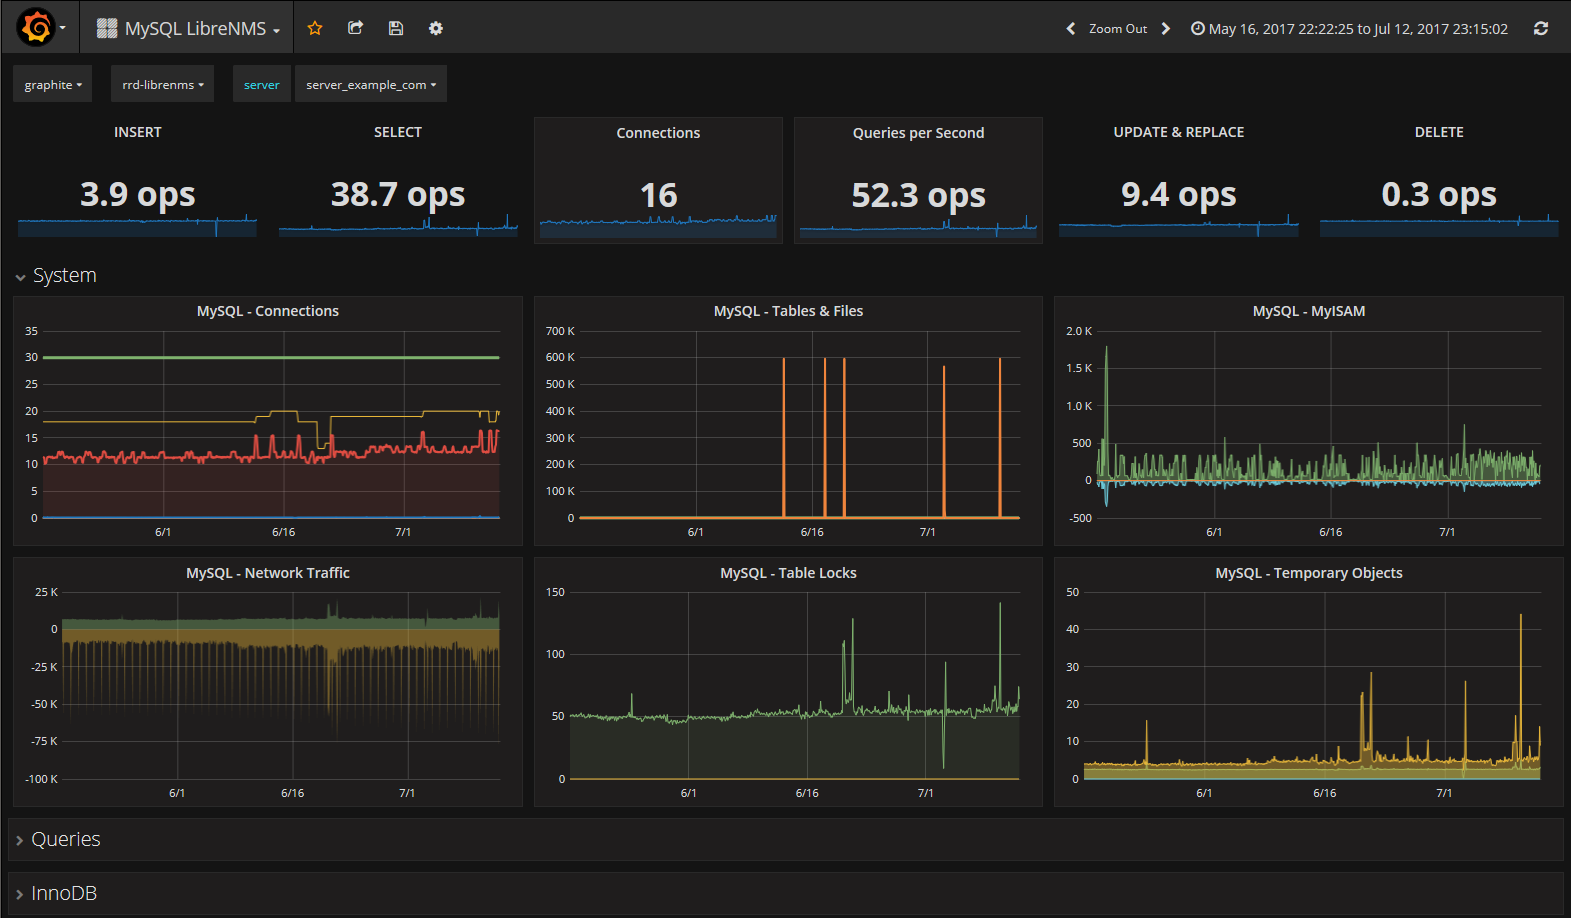
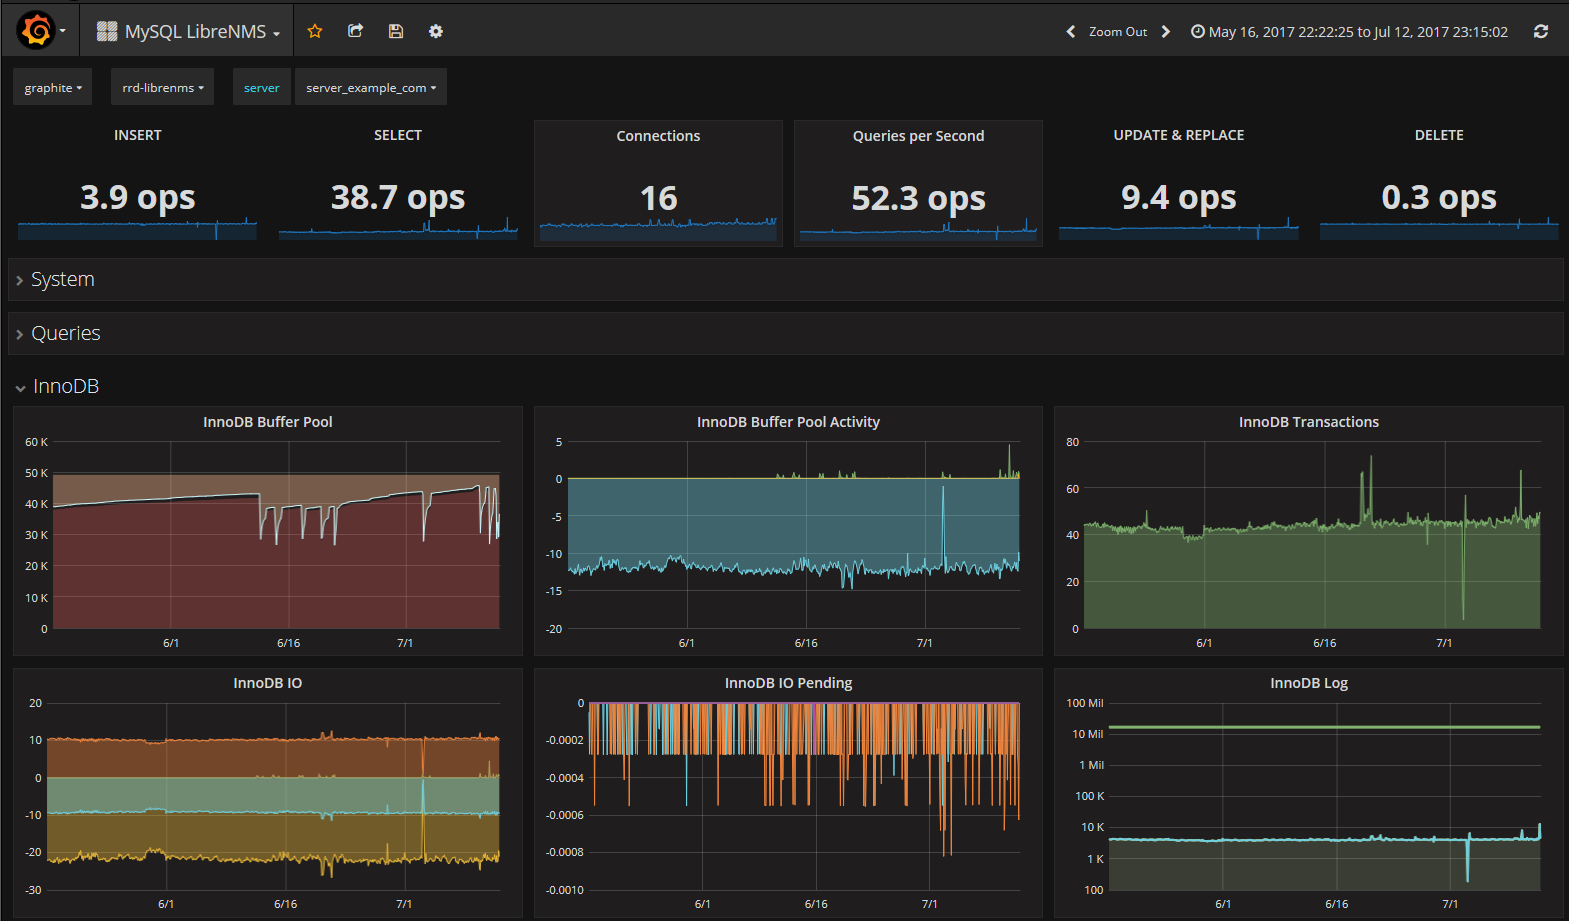
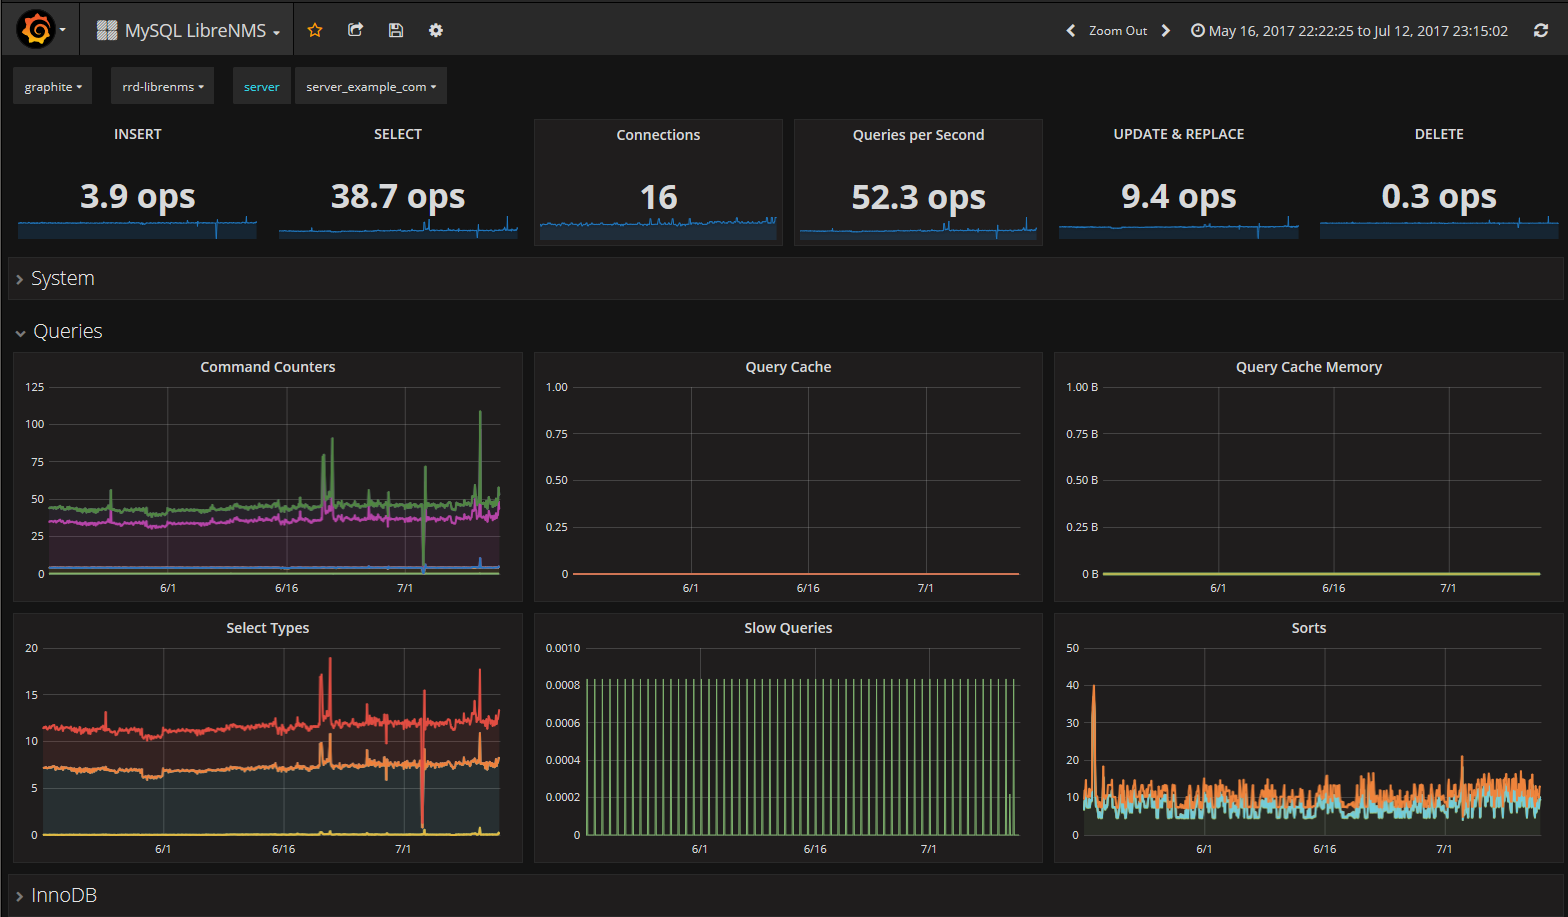
MySQL Overview provided by LibreNMS, read via Graphite and displayed via Grafana!
MySQL LibreNMS Dashboard
MySQL Overview provided by LibreNMS, read via Graphite and displayed via Grafana!
Metric Field description
rootdir= also known as prefix, used to summarize metrics of a collector.server= Server Name without.instance= automatically choosen app instance in LibreNMS.value= Value/Measurement
Dependencies
- LibreNMS (http://www.librenms.org/)
- Graphite (with access to RRD files from LibreNMS).
- Grafana
Graphite RRD Files
Note: This Dashboard is designed to use the RRD Graphs directly. No need to configure graphite output extension in LibreNMS!
Please keep in mind that hostnames usually contain .. You may want to consider symlinking in STORAGE_DIR/rrd instead, as this dashboard uses only the 2nd field for the hostname.
Configuration
- configure MySQL App in LibreNMS (http://docs.librenms.org/Extensions/Applications/#mysql)
- Import Dashboard and select the appropriate values at the top variable list for: datasource, rootdir, server.
- Enjoy!
Links
Data source config
Collector config:
Upload an updated version of an exported dashboard.json file from Grafana
| Revision | Description | Created | |
|---|---|---|---|
| Download |
MySQL
Monitor MySQL with Grafana. Easily monitor your MySQL deployment with Grafana Cloud's out-of-the-box monitoring solution.
Learn more


