Telegraf Windows Instances
InfluxDB dashboards for telegraf metrics
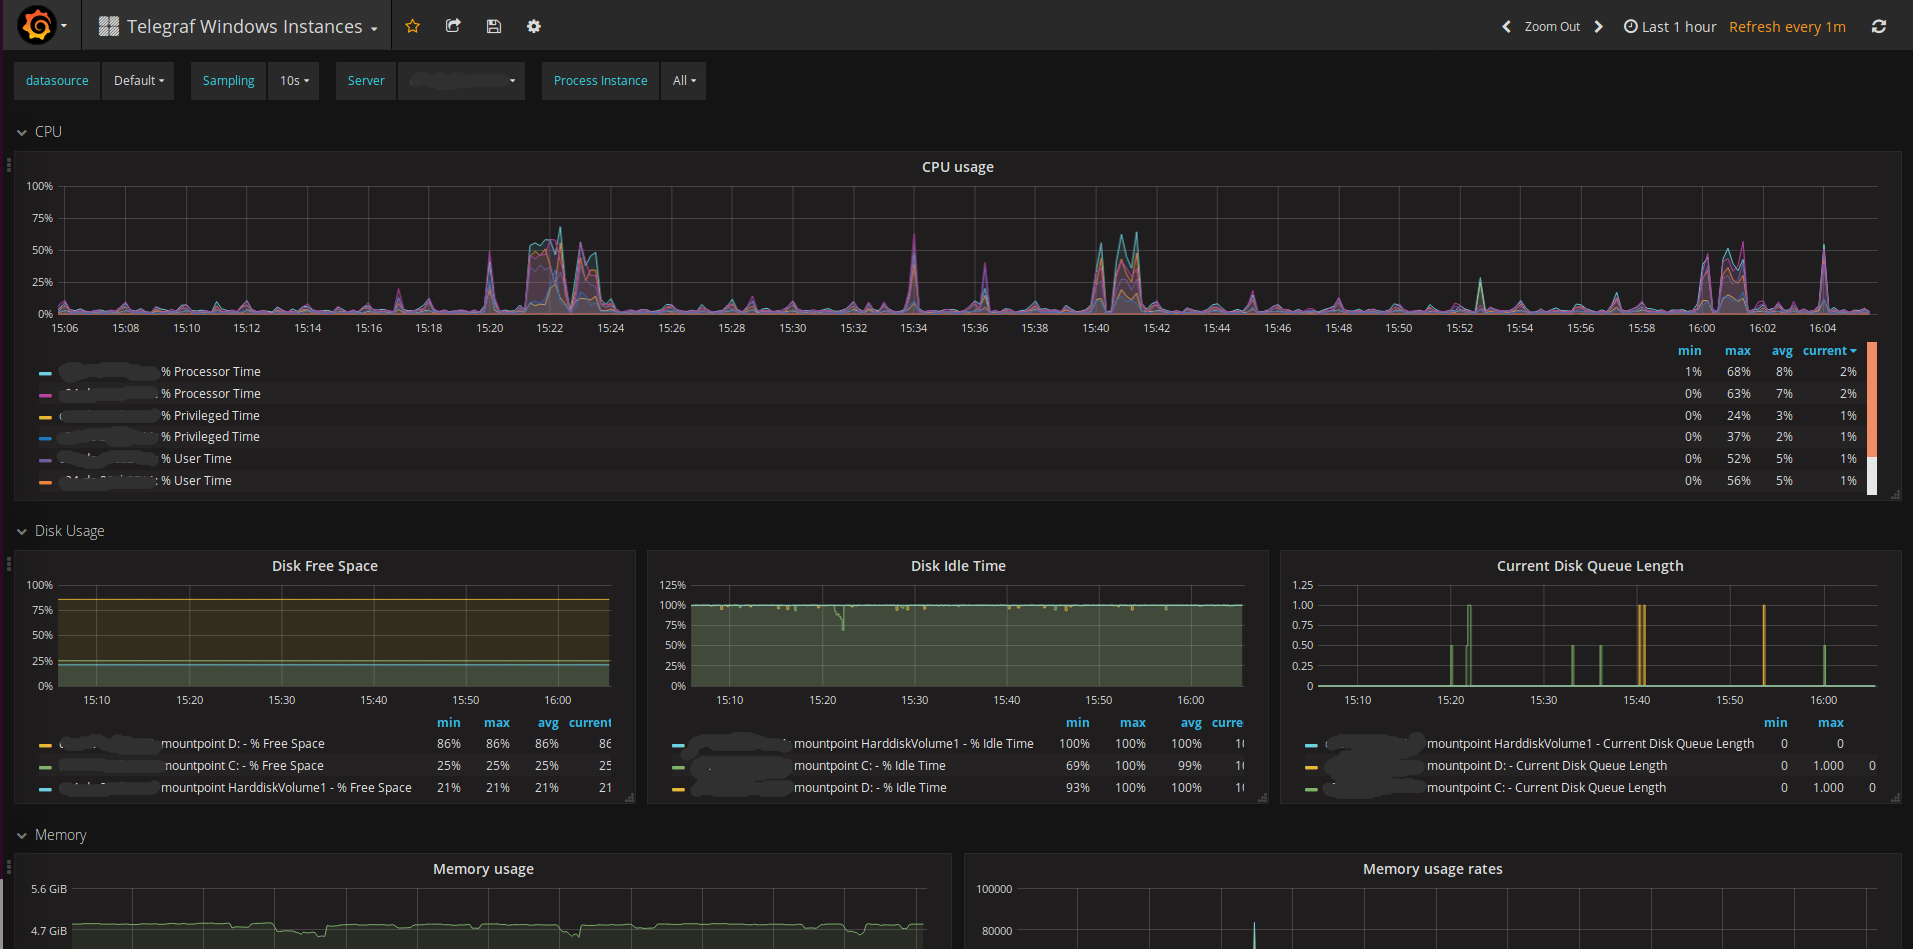
A Grafana dashboard for showing Windows Telegraf metrics, from an InfluxDB backend.
This requires the majority of inputs listed in the Generic
Queries and Process sections at the win_perf_counters
documentation
to be enabled on Telegraf clients.
Based on Telegraf templated host overview by lex.
Source also at github.com
Data source config
Collector type:
Collector plugins:
Collector config:
Revisions
Upload an updated version of an exported dashboard.json file from Grafana
| Revision | Description | Created | |
|---|---|---|---|
| Download |
Windows
Easily monitor your deployment of the Windows operating system with Grafana Cloud's out-of-the-box monitoring solution.
Learn more