Docker-Swarm-Monitor-v2
Docker Swarm Monitor Dashboad v2.0
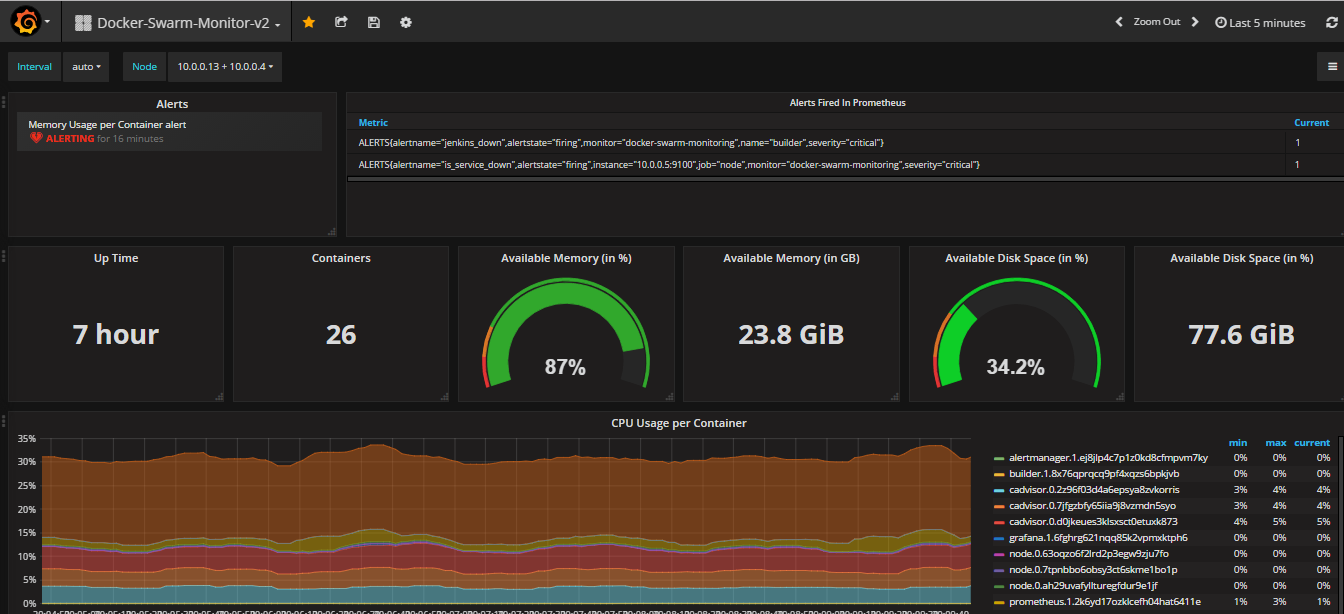
- cAdvisor is used to collect container metrics
- Node Exporter is used to collect node/host metrics
- Prometheus scrapes metrics from cAdvisor and Node Exporter
- Grafana retrieves the metric data form Prometheus and displays them as nicely looking graphs
Data source config
Collector type:
Collector plugins:
Collector config:
Revisions
Upload an updated version of an exported dashboard.json file from Grafana
| Revision | Description | Created | |
|---|---|---|---|
| Download |
Docker
Easily monitor Docker with Grafana Cloud's out-of-the-box monitoring solution.
Learn more