


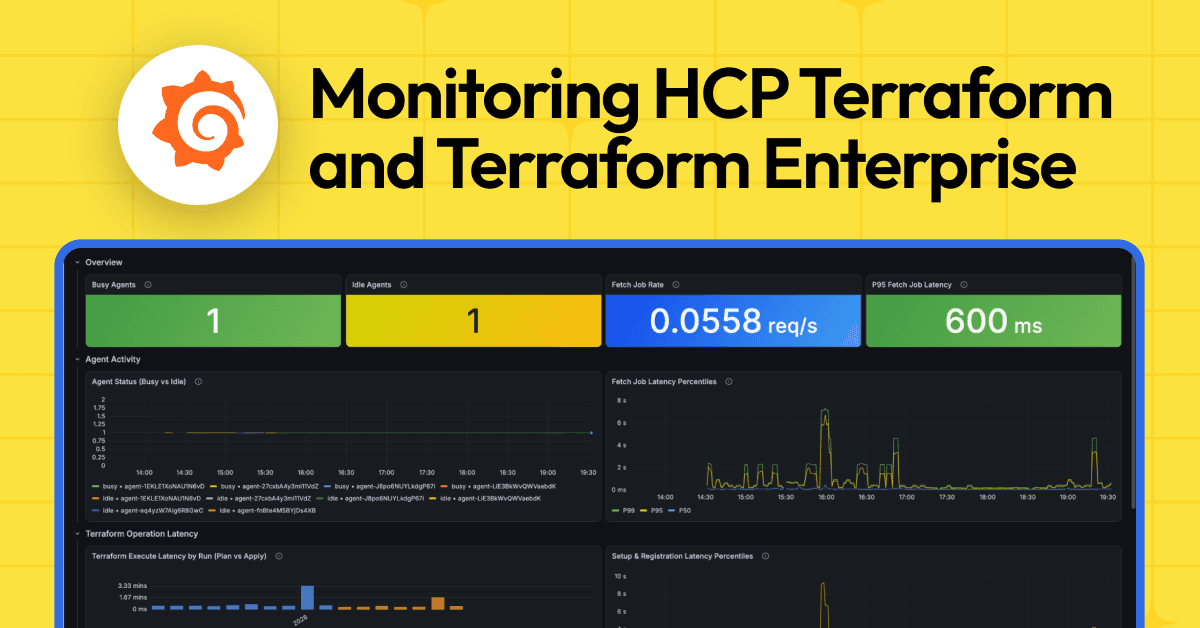
How to monitor HCP Terraform and Terraform Enterprise with Grafana Cloud


When a Terraform run feels slow, most teams are flying blind. The run log in HCP Terraform tells you what happened, but not what took so long—and it certainly doesn't roll up across hundreds of runs so you can spot a trend.
The good news: when you run your plans and apply on HCP Terraform or Terraform Enterprise self-hosted Terraform agents, each agent already emits OpenTelemetry data—distributed traces for every run phase and granular runtime metrics—and it writes structured logs to stdout. You just need something to collect it.
This post shows how to monitor your HCP Terraform or Terraform Enterprise runs by pointing a self-hosted agent at Alloy and shipping traces, metrics, and logs into Grafana Cloud so you can be sure your deployment operates properly going forward.
By the end you'll have this pipeline running locally:
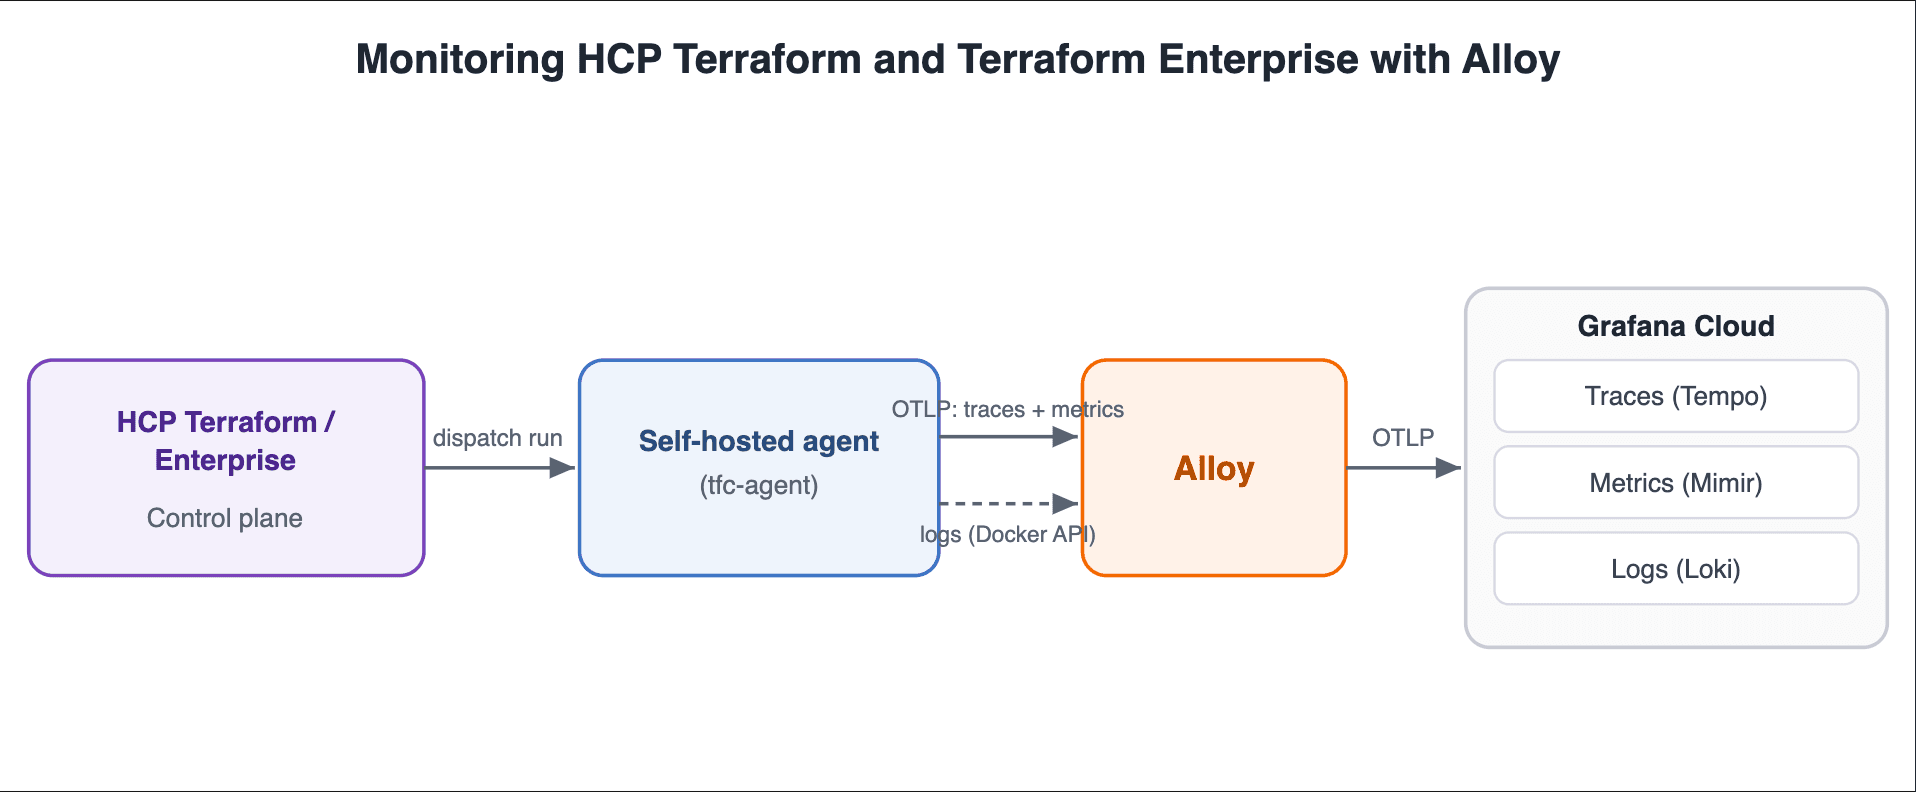
HCP Terraform dispatches a run to a self-hosted agent, which sends traces and metrics over OTLP and logs via the Docker Engine API to Alloy, which exports all three signals over OTLP to Grafana Cloud Traces, Metrics, and Logs
What you'll need
Note: The steps outlined in this blog post can be applied to monitoring either HCP Terraform or Terraform Enterprise, but for the remainder of this post we will focus on HCP Terraform. Similar to Grafana Cloud, it offers a free tier, which means you can test the setup at no cost.
You can run this entire walkthrough on your laptop with Docker. But before you start, make sure you have:
- An HCP Terraform account: The HCP Terraform free tier includes one self-hosted agent (up to ~500 managed resources). The setup described in this post does not work with Terraform CLI alone because it lacks the Terraform agents feature
- A Grafana Cloud account: The free tier includes Grafana Cloud Traces, Grafana Cloud Metrics, and Grafana Cloud Logs, plus an OpenTelemetry Protocol (OTLP) gateway endpoint that accepts all three signals
- Terraform CLI (1.x) installed locally
- Docker and Docker Compose
- Your Grafana Cloud OTLP endpoint URL, instance ID, and an access token with metrics, logs, and traces write scopes. You'll find these under Connections > OpenTelemetry > OTLP in Grafana Cloud.
Note: There are several ways to run both Alloy and the HCP Terraform agent: standalone binaries, a Kubernetes deployment, a systemd service, and more. To keep the setup self-contained and easy to reproduce, this document runs in Docker via Docker Compose.
The Terraform agent emits traces and metrics over OTLP, and the logs go to stdout/stderr. There is no OTLP logs signal from the agent. We'll capture those logs separately via Alloy's Docker integration.
We use Alloy to receive the agent's OTLP metrics and traces, tail the Terraform agent's container logs, normalize, and forward it all to Grafana Cloud.
Part 1: Set up HCP Terraform
1a. Create an agent pool and token
An agent pool is a group of self-hosted agents that HCP Terraform dispatches runs to. In your organization, go to Settings > Agents > Create agent pool, give it a name (here, demopool), then select Create token and copy the token—you'll only see it once. This Terraform agent token will be passed to the environment variable TFC_AGENT_NAME.
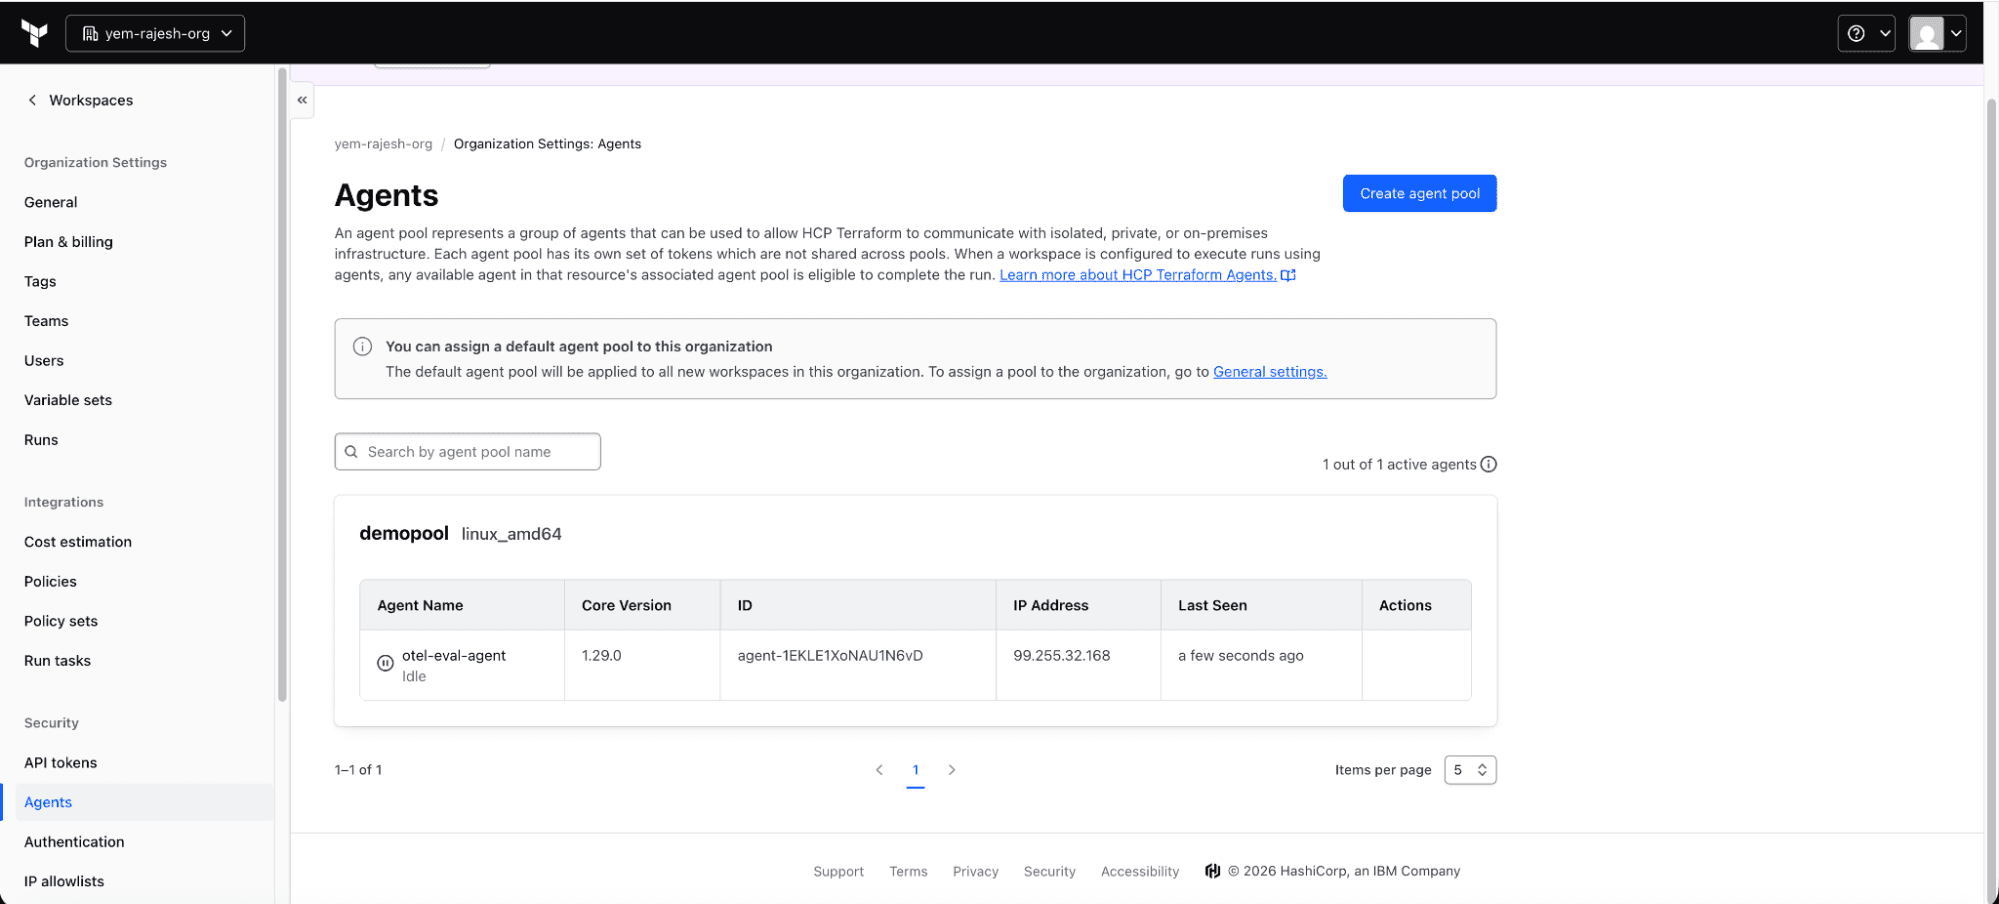
The HCP Terraform Agents page showing the agent pool with one active agent
1b. Point a workspace at the agent pool
This is the step people most often miss. Telemetry is only produced when a run executes on your agent. The workspace must use agent execution mode, not the default remote mode or other modes. (A remote workspace runs on HashiCorp's infrastructure, so your local agent will stay idle and you'll only see heartbeat metrics with no run traces.)
Create (or open) a workspace, then go to Settings > General > Execution mode, choose Agent, and select your pool.
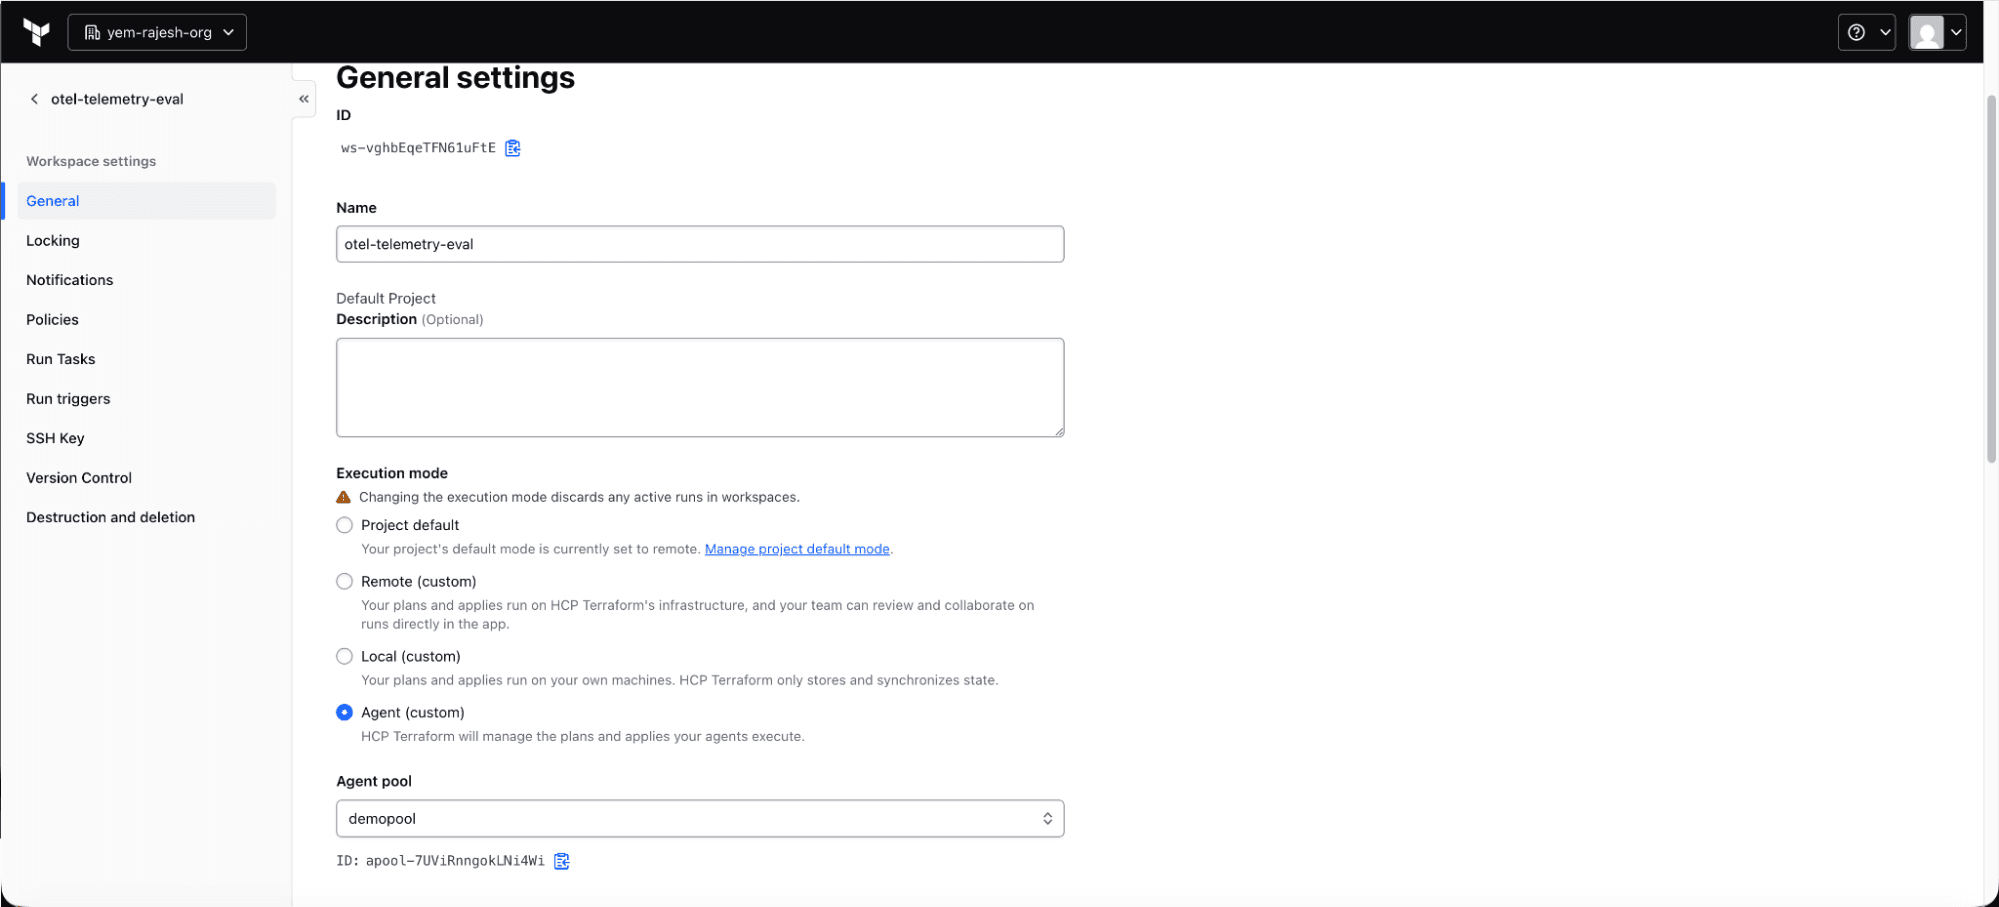
HCP Terraform workspace general settings with execution mode set to Agent and agent pool set to demopool (user defined name).
In the example above, a project with the name otel-telemetry-eval is set to Agent execution mode, bound to agent pool. With this in place, every plan and apply is handed to your self-hosted agent—which is what generates the trace spans.
Part 2: Collect telemetry with Alloy
2a. The Alloy pipeline (config.alloy)
Create config.alloy to receive metrics and traces from OTLP and logs from our Docker integration.
Update the Grafana OTLP gateway endpoint, username, and password from your Grafana Cloud stack to the respective environment variables.
// tfc-agent pushes traces + metrics here (OTLP gRPC).
otelcol.receiver.otlp "default" {
 grpc {
   endpoint = "0.0.0.0:4317"
 }
 output {
   metrics = [otelcol.processor.deltatocumulative.default.input]
   traces  = [otelcol.processor.batch.default.input]
 }
}


// Agent stdout/stderr: read directly from the Docker Engine API.
// discovery.docker lists all containers; discovery.relabel keeps only the agent
discovery.docker "containers" {
 host = "unix:///var/run/docker.sock"
}


discovery.relabel "tfc_agent" {
 targets = discovery.docker.containers.targets
 rule {
   source_labels = ["__meta_docker_container_name"]
   regex         = ".*tfc-agent.*"
   action        = "keep"
 }
}


loki.source.docker "tfc_agent" {
 host       = "unix:///var/run/docker.sock"
 targets    = discovery.relabel.tfc_agent.output
 forward_to = [otelcol.receiver.loki.default.receiver]
}


// Bridge Loki-native log entries into the OTLP pipeline so logs share the same
// transform/batch/exporter path as traces and metrics.
otelcol.receiver.loki "default" {
 output {
   logs = [otelcol.processor.transform.logs.input]
 }
}


// tfc-agent emits delta-temporality metrics; Grafana Cloud (Prometheus/Mimir) only accepts cumulative. (Experimental component -> needs --stability.level=experimental.)
otelcol.processor.deltatocumulative "default" {
 output {
   metrics = [otelcol.processor.batch.default.input]
 }
}


// update the service.name to tfc-agent in logs so that traces and logs are correlated
otelcol.processor.transform "logs" {
 error_mode = "ignore"
 log_statements {
   context = "resource"
   statements = [
     `set(resource.attributes["service.name"], "tfc-agent")`,
   ]
 }
 output {
   logs = [otelcol.processor.batch.default.input]
 }
}


otelcol.processor.batch "default" {
 output {
   metrics = [otelcol.exporter.otlphttp.grafana.input, otelcol.exporter.debug.default.input]
   traces  = [otelcol.exporter.otlphttp.grafana.input, otelcol.exporter.debug.default.input]
   logs    = [otelcol.exporter.otlphttp.grafana.input, otelcol.exporter.debug.default.input]
 }
}


otelcol.auth.basic "grafana" {
 username = sys.env("GRAFANA_CLOUD_INSTANCE_ID")
 password = sys.env("GRAFANA_CLOUD_TOKEN")
}


otelcol.exporter.otlphttp "grafana" {
 client {
   endpoint = sys.env("GRAFANA_CLOUD_URL")
   auth     = otelcol.auth.basic.grafana.handler
 }
}


otelcol.exporter.debug "default" {
 verbosity = "detailed"
}
services:
 alloy:
   image: grafana/alloy:latest
   user: root
   command:
     - run
     - --server.http.listen-addr=0.0.0.0:12345
     - --stability.level=experimental
     - /etc/alloy/config.alloy
   environment:
     # Secrets come from ./.env (gitignored) — read via sys.env() in config.alloy.
     GRAFANA_CLOUD_INSTANCE_ID: "${GRAFANA_CLOUD_INSTANCE_ID}"
     GRAFANA_CLOUD_TOKEN: "${GRAFANA_CLOUD_TOKEN}"
     GRAFANA_CLOUD_URL: "${GRAFANA_CLOUD_URL}"
   volumes:
     - ./config.alloy:/etc/alloy/config.alloy
     - /var/run/docker.sock:/var/run/docker.sock:ro   # loki.source.docker reads logs here
   ports:
     - "4317:4317"       # OTLP gRPC (traces + metrics from agent)
     - "12345:12345"     # Alloy UI  ->  http://localhost:12345


 # HCP Terraform self-hosted agent — identical to the collector setup, but points at "alloy".
 tfc-agent:
   image: hashicorp/tfc-agent:latest
   platform: linux/amd64
   depends_on:
     - alloy
   environment:
     TFC_AGENT_TOKEN: "${TFC_AGENT_TOKEN}"
     TFC_AGENT_NAME: "otel-eval-agent"
     TFC_AGENT_OTLP_ADDRESS: "alloy:4317"   # traces+metrics -> Alloy
     TFC_AGENT_LOG_LEVEL: "info"
The single flag that turns telemetry on is TFC_AGENT_OTLP_ADDRESS (equivalently otlp -address), pointing at Alloy's OTLP receiver. For a TLS-secured collector you'd also set TFC_AGENT_OTLP_CERT_FILE.
Part 3: Ship to Grafana Cloud and verify
3a. Provide credentials
Keep secrets out of the config with a .env file (Docker Compose loads it automatically—add it to .gitignore):
# .env
TFC_AGENT_TOKEN=<your-agent-pool-token>
GRAFANA_CLOUD_INSTANCE_ID=<your-instance-id>
GRAFANA_CLOUD_TOKEN=<your-grafana-cloud-access-token>
GRAFANA_CLOUD_URL=https://otlp-gateway-<zone>.grafana.net/otlp
# Start Alloy and the agent
docker compose -f docker-compose.yml up -d
The agent should register (visible on the HCP Terraform Agents page from Part 1a). Now log in and trigger a run from any workspace bound to the pool:
# Trigger a run that executes on your agent
terraform login
terraform init
terraform apply/ destroy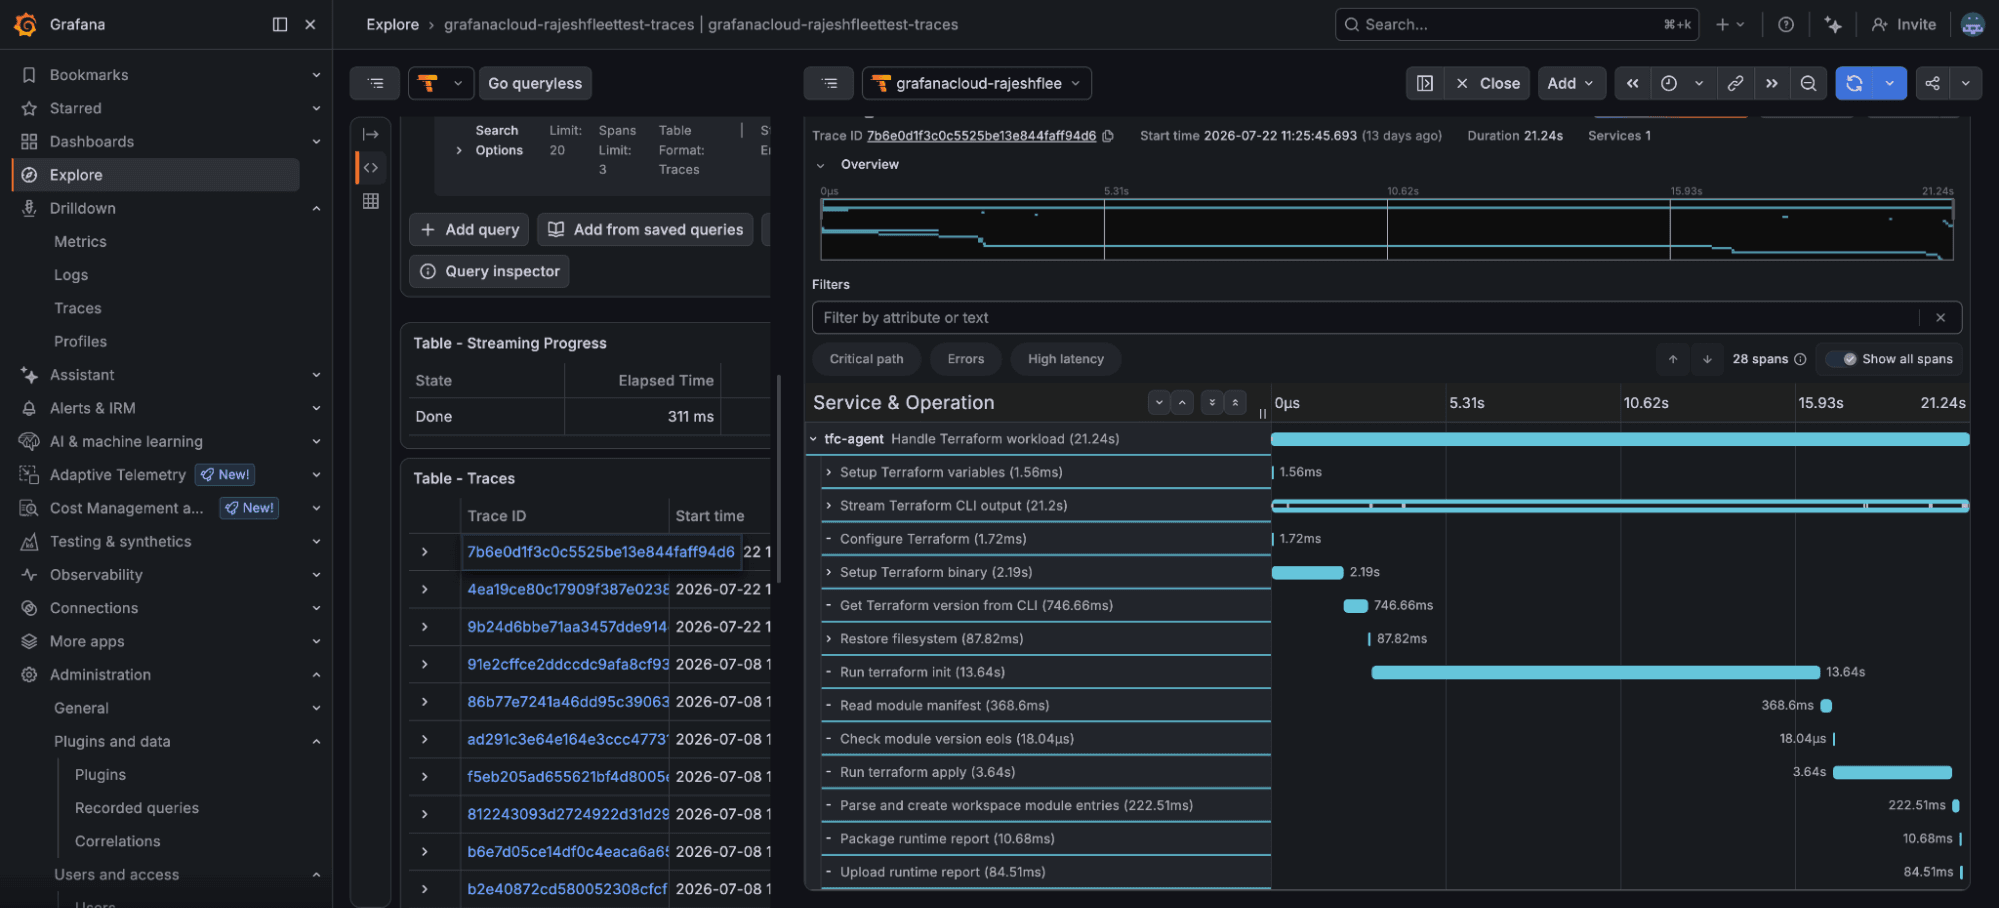
Grafana Explore traces view listing traces for service tfc-agent, each named Handle Terraform workload, with trace IDs, start times, and durations
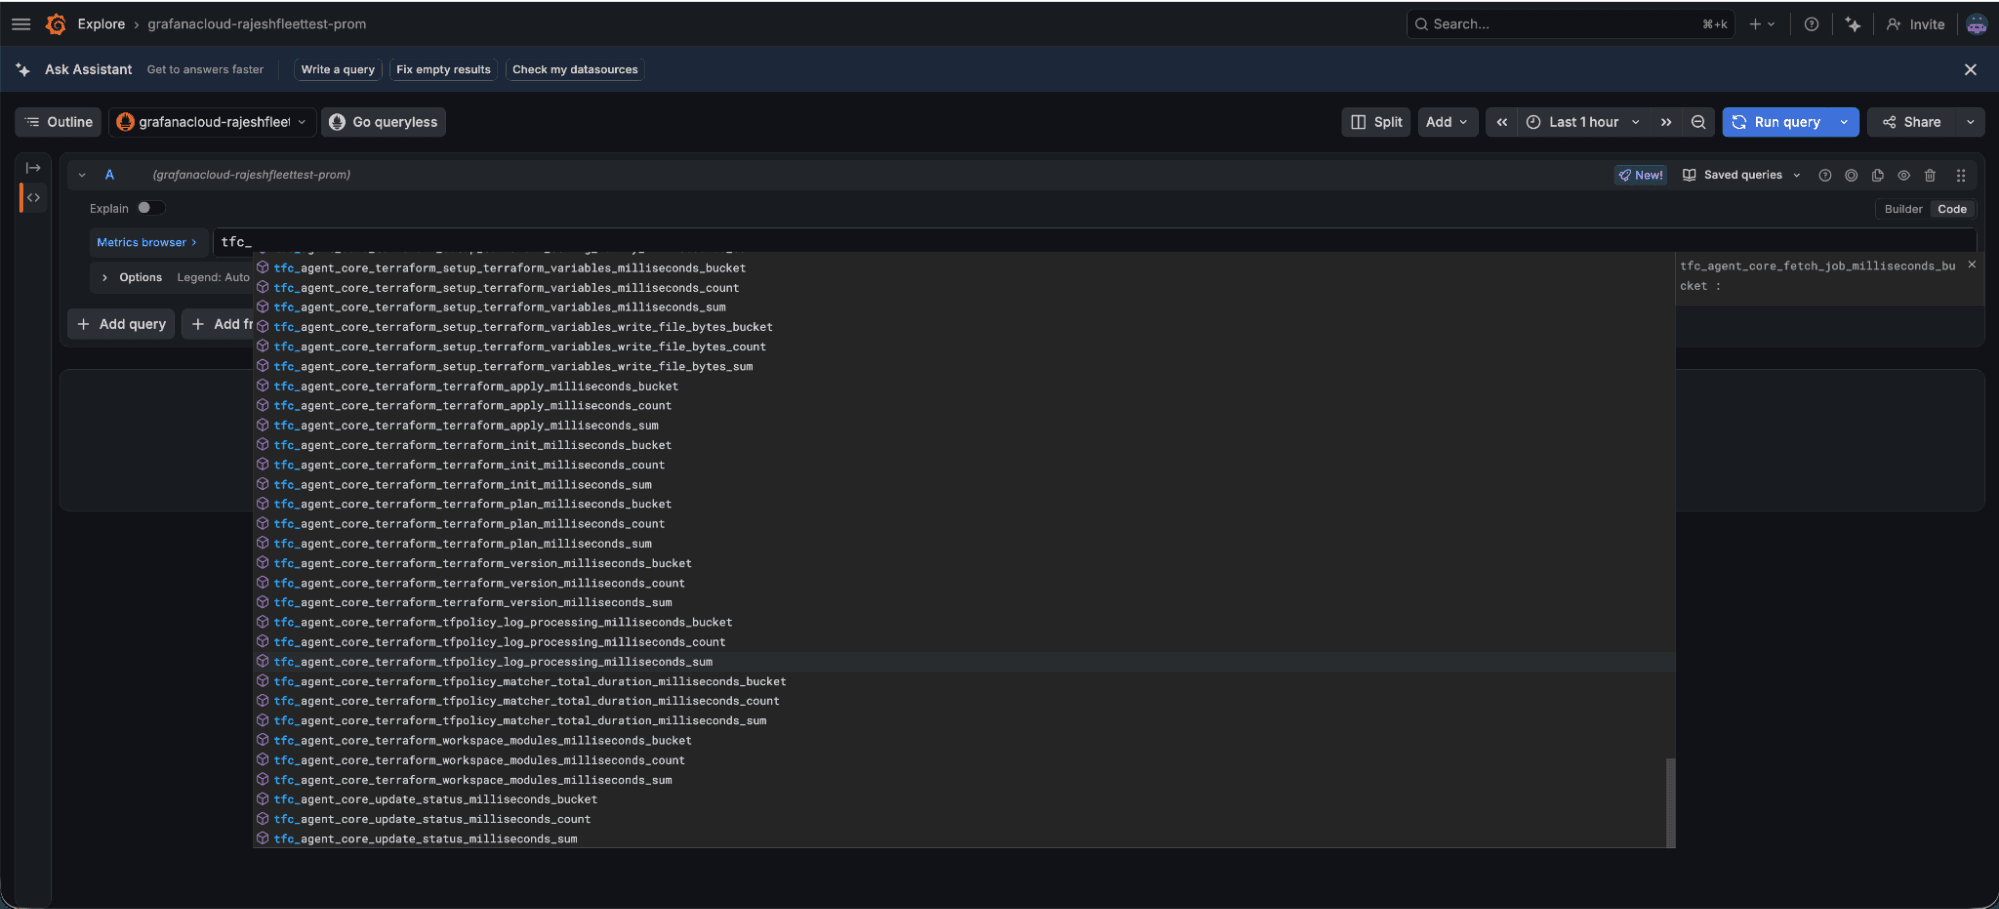
Grafana metrics browser listing tfc_agent_core metrics including terraform_apply, terraform_init, terraform_plan milliseconds histograms, and fetch_job milliseconds
Note: Watch out for one thing here. The Terraform agent emits delta-temporality metrics, but Grafana Cloud Metrics only accepts cumulative. The
otelcol.processor.deltatocumulativecomponent in the pipeline handles that.
3e. See your logs
Select your Grafana Cloud Logs (Loki) data source and query {service_name="tfc-agent"}:
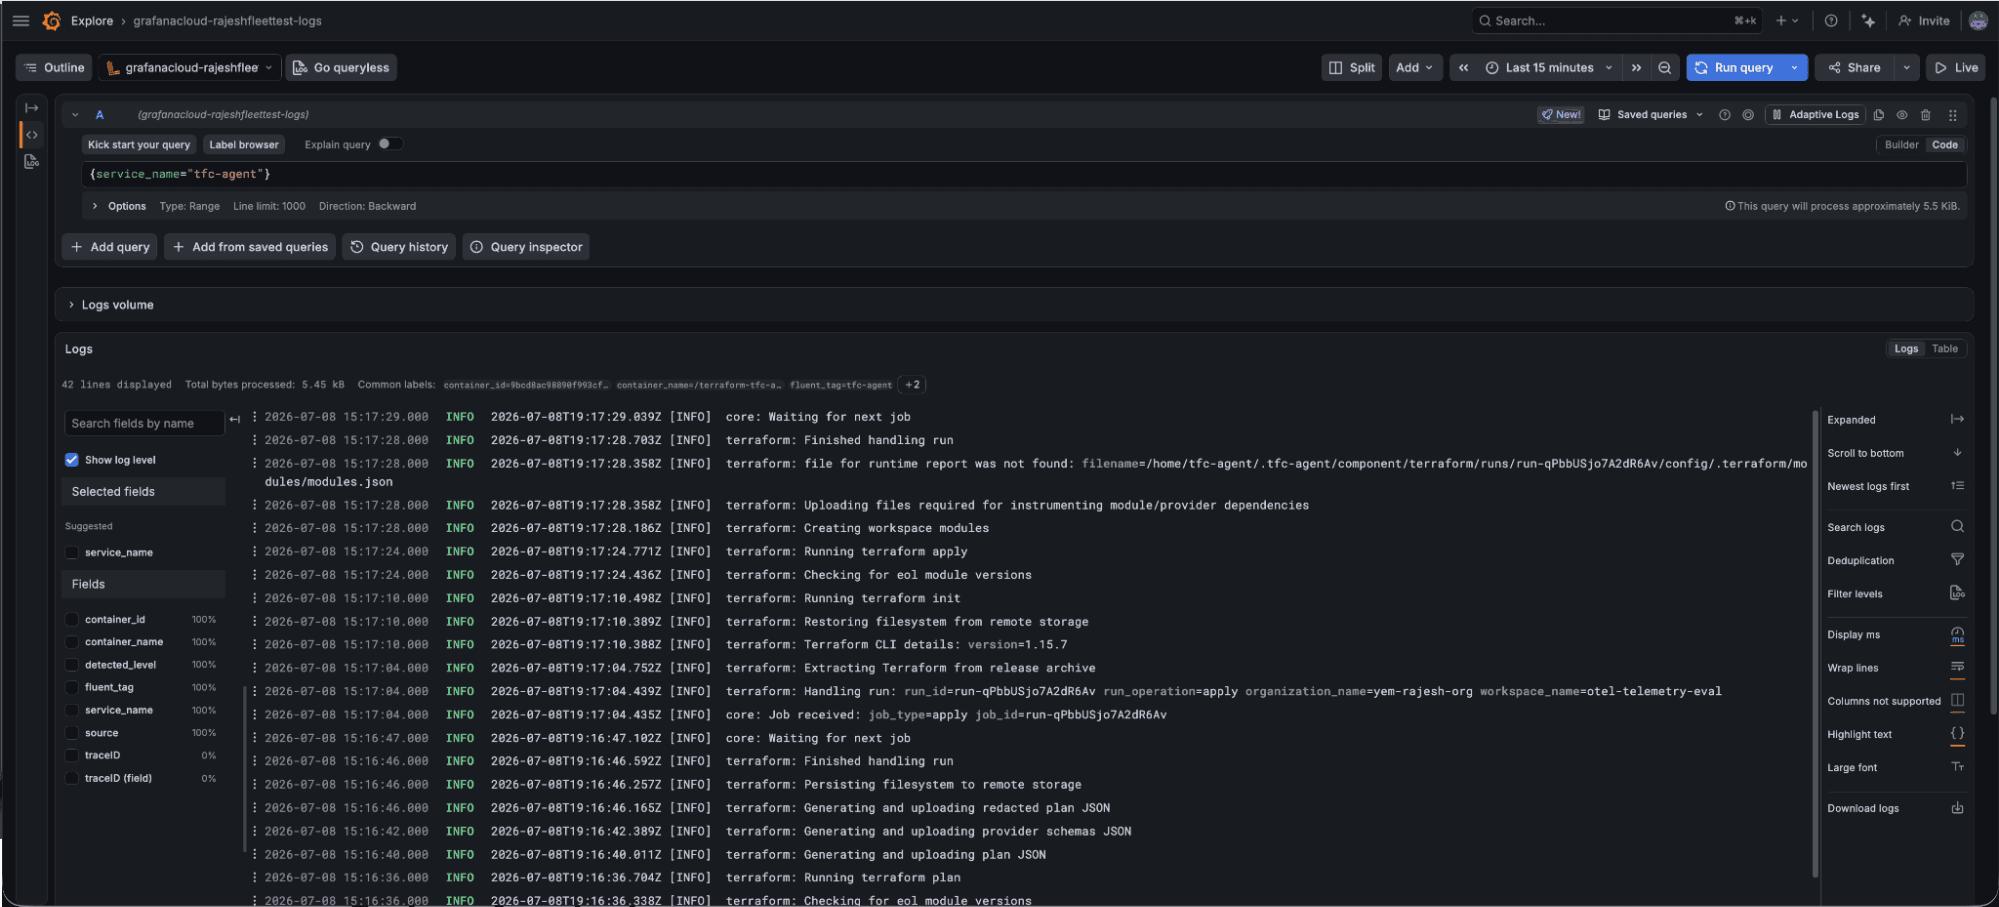
Grafana Explore logs view showing tfc-agent run logs including Handling run, Running terraform init, Running terraform apply, and Finished handling run, with service_name labels
And that's it. With just a few minutes of work, you have real time visibility into the state of your Terraform workload.
The gotchas
A few things that will save you time:
- Execution mode is everything. If a workspace is in remote mode, runs never touch your agent and you'll get metrics only (idle heartbeats), no traces. Set it to agent mode.
- Use multiple Terraform agents: Each agent process runs a single Terraform run at a time and queues others. Multiple agent processes can be concurrently run, provided the org has a license.
- Terraform agent equals traces and metrics only. Its logs are stdout/stderr; capture them via
loki.source.docker(as we did in the steps above) or a log driver. They are not part of the OTLP stream. - Temporality matters. Convert delta to cumulative before shipping to Grafana Cloud Metrics, or metrics get rejected.
service.namecorrelates the signals. OTLP traces and metrics set it automatically; apply it on logs too so all three line up under one service in Grafana.- Pin your collector version. Component availability, and even architecture-specific image builds, vary between releases. Pin a known-good tag rather than the latest tag for anything beyond a quick evaluation.
Grafana Assistant is the easiest way to get started with metrics, logs, traces, dashboards, and more in Grafana Cloud. We have a generous forever-free tier and plans for every use case. Sign up for free now!


