

%3Aquality(100)%2F&w=3840&q=75)
%3Aquality(100)%2F&w=3840&q=75)
Grafana 13.2 release: easier ways to query and explore your data


Grafana 13.2 is here, bringing more improvements to help you and your team explore your data and get to insights faster.
In this post, we’ll highlight the latest updates to saved queries, a feature that lets teams share, discover, and reuse queries to get to trusted answers faster and help new teammates get up to speed. We’ll also explore how the new View panel sidebar makes exploring busy panels a breeze.
If you want to read about all the latest updates in Grafana 13.2, please refer to the changelog or our What’s New documentation.
Saved queries: reuse trusted queries across dashboards and teams
Good queries are hard-won. Writing one means knowing both the query language and your own data, like which of four similarly named metrics is the one you can trust. That knowledge usually sits with a few experienced people, or is gradually learned through exploration (increasingly AI-assisted), validation, and revision. Often teams end up rebuilding the same Grafana queries over and over, and the best ones live in pinned Slack messages or get copy-pasted from old dashboards. New team members feel it most, since their first weeks are often spent reverse-engineering existing dashboards just to work out how to ask a question of their own.
The query history in Grafana Explore helps, keeping a couple of weeks of your own queries and letting you “star” the keepers. It's private to you, though. Until recently, there hasn't been a built-in way to take a query you trust and put it somewhere your whole organization can find it.
How teams use saved queries
We built saved queries, which is now generally available in Grafana Cloud and Grafana Enterprise, to address this challenge by providing a shared query library for your organization. When you write a query worth keeping, you can save it with a title, description, and tags. Saving works from dashboard panels, Explore, and annotation queries. This means teammates who don't know PromQL or SQL can still build dashboards from queries that the experts already vetted.
%3Aquality(100)%2F&w=3840&q=75)
Anyone in your organization can then browse the library in the saved queries dialog, searching by title, description, data source, or the query text itself, with filters for author and tags and the option to star favorites. From there, you can add a saved query to the panel you're editing, replace the query you're working on, or open it in Explore. And if a saved query contains variables, you can map them to your own dashboard's variables (or to plain values) when you reuse it, so a query written for one dashboard still works in another.
Saved queries also supports role-based access control, so you can choose who curates the library and who reuses from it.
New ways to access saved queries and manage them as code
Grafana 13.2 makes it easier to work with saved queries across your organization: you can now find them from anywhere in Grafana with the command palette and manage your shared query library as code via Terraform.
Find saved queries from anywhere with the command palette
Press Cmd/Ctrl+K and choose Open saved queries to browse the library from wherever you are in Grafana Cloud or Grafana Enterprise. From the dialog, you can open a query straight into Explore, where it loads ready to run.
%3Aquality(100)%2F&w=3840&q=75)
Provision saved queries with Terraform
You can also now manage saved queries as code. Define your team's shared queries in configuration to version-control the library and prepopulate trusted queries for new users. This also allows you to manage saved queries as part of a repeatable infrastructure workflow.
Build your library with Grafana Assistant
One great way to start populating your saved queries is to use Grafana Assistant, the AI-powered agent in Grafana Cloud, to help you craft and fine-tune queries that give you the answers you need.
Grafana Assistant now supports over 30 data sources, so no matter where your data lives, you can ask questions in natural language and build a library of trusted, efficient queries for you and your team to have at your fingertips.
Grafana Assistant is available in Grafana Cloud, including in the free tier, and is also accessible from self-managed versions of Grafana (from Grafana 13 onwards). To configure Assistant in Grafana OSS, simply install the plugin and connect to a Grafana Cloud account (again, including in the free tier).
%3Aquality(100)%2F&w=3840&q=75)
To learn more, check out our technical docs for saved queries and Grafana Assistant.
The View panel sidebar: a better way to explore time series panels
When a graph contains many overlapping series, it can be difficult to tell which ones are driving a spike, dip, or other anomaly. And if you’re assigned the Viewer role, your options can be limited.
The View panel sidebar makes it easier for viewers to explore and investigate dashboard data without edit permissions or changing the saved dashboard. From the sidebar, you can adjust supported visualization options such as legends and stacking, or use fanout to split a dense graph into separate graphs by series or label value.
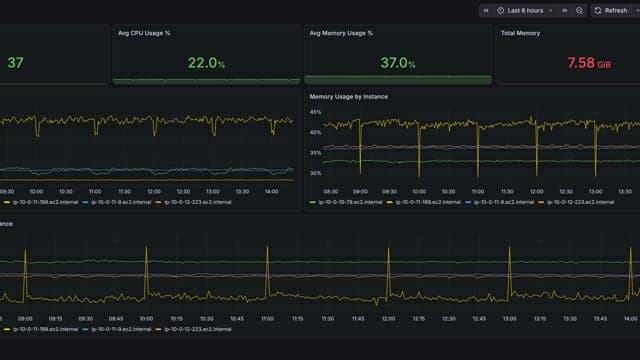
The exact controls depend on the panel plugin, so each visualization exposes the options that make sense for that panel type.
The View panel sidebar is available in public preview in all editions of Grafana.
More highlights from the 13.2 release
Grafana 13.2 includes a range of other new features and bug fixes, including:
Git Sync updates: manage your dashboards as code
We continue to expand Git Sync, a feature that provides the power of Git version control right within your Grafana instance and lets you manage dashboards as code.
Here’s what’s new in Git Sync with the 13.2 release:
GitHub Enterprise support: Git Sync now supports GitHub Enterprise, both Server and Cloud versions. This means you can provision your dashboards as JSON files and your folders in your GitHub Enterprise instance using Git Sync.
Webhooks available for GitLab and BitBucket: In Grafana OSS and Enterprise, Git Sync uses webhooks to enable real-time updates from GitHub public repositories, or to enable pull request integrations. Webhooks are now available for GitLab and BitBucket.
Authoring commits in Git Sync: You can now include authoring information on your commits. This makes it easy to see who actually made a change when reviewing your Git history, and pairs with commit signing for verified authorship.
To learn more about Git Sync, which is generally available in all editions of Grafana, refer to our docs.
All roads lead to home: a refreshed Grafana homepage
The default homepage for Grafana OSS and Enterprise has been updated to align with the cleaner, more modern design you see in Grafana Cloud.
%3Aquality(100)%2F&w=3840&q=75)
It still surfaces your recent and starred dashboards, but now also highlights firing alerts to help you take action faster. If you've got Grafana Assistant installed and enabled, you can also start a chat with Assistant right from the homepage.
Updates to data sources, data visualization, and more
- Workload Identity Federation support for BigQuery and Google Cloud Monitoring data sources: Connect to BigQuery and Google Cloud Monitoring with secure, short lived credentials.
- Redesigned query variable editor: Create query variables more easily with the redesigned editor experience.
- Multi-select grouping for dashboards: Select multiple panels at once and instantly group them into a row or a tab, making it easy to restructure dashboards.
…plus much more. For the full list of updates in Grafana 13.2, check out our What’s New documentation.
Learn more about Grafana
For an in-depth list of all the new features in Grafana, check out our Grafana documentation, the Grafana changelog, or our What's New documentation.
Join the Grafana Labs community
We invite you to engage with the Grafana Labs community forums. Share your experiences with the new features, discuss best practices, and explore creative ways to integrate these updates into your workflows. Your insights and use cases are invaluable in enriching the Grafana ecosystem.
Upgrade to Grafana 13.2
Download Grafana 13.2 today or experience all the latest features by signing up for Grafana Cloud, which offers an actually useful forever-free tier and plans for every use case. Sign up for a free Grafana Cloud account today.
Our Grafana upgrade guide also provides step-by-step instructions for those looking to upgrade from an earlier version to ensure a smooth transition.
Special thanks to our community
We extend our heartfelt gratitude to the Grafana community!
Your contributions, ranging from pull requests to valuable feedback, are crucial in continually enhancing Grafana. And your enthusiasm and dedication inspire us at Grafana Labs to persistently innovate and elevate the Grafana platform.
Grafana Assistant is the easiest way to get started with metrics, logs, traces, dashboards, and more in Grafana Cloud. We have a generous forever-free tier and plans for every use case. Sign up for free now!


