

Grafana 10.4 release: Grafana Alerting improvements, visualization updates, new plugin, and more
Grafana 10.4 is here! The latest version of Grafana introduces feature updates, a new plugin, as well as provides a preview of functionality we intend to make generally available in Grafana 11, which will be featured at GrafanaCON 2024 in April.
Until then, the Grafana 10.4 release includes upgrades to the canvas, geomap, and table visualizations. There is also a quicker way to set up alert notifications in Grafana Alerting and a new UI for configuring SSO.
For an in-depth list of all the new features in Grafana 10.4, check out our Grafana documentation, the Grafana changelog, or our What’s New documentation.
Let’s dive into 10.4!
📊Grafana visualizations
Canvas panels
Generally available in all editions of Grafana
The Canvas panel, which became generally available in Grafana 10, are extensible form-built visualizations that allow you to explicitly place elements within static and dynamic layouts. This empowers you to design custom visualizations and overlay data in ways that aren’t possible with standard Grafana panels, all within Grafana’s UI.
In this release, elements will now snap into place and automatically align with each other within a canvas, allowing you to more precisely add custom components to your panel. This builds on recent improvements to pan and zoom, and the ability to add interactive buttons to the Canvas panel.
For more information, check out our documentation.
Geomap updates
Generally available in all editions of Grafana
The geomap geojson layer now supports styling, such as polygons, point color/size, and line strings.
To learn more, refer to the documentation.

Table panel improvements
Generally available in all editions of Grafana
You can now view your data links inline to help you keep your tables visually streamlined.
You can also create subtables out of your data using the new group to nested tables transformations. To use this feature, enable the groupToNestedTableTransformationfeature toggle.
🚨Grafana Alerting
Note: We previously announced the deprecation of legacy alerting in Grafana 9. Legacy alerting will officially be removed from the Grafana codebase starting in Grafana 11. We recommend that you upgrade to the new Grafana Alerting as soon as possible to ensure there is no interruption with your alerting system. For more information, refer to legacy alerting deprecation documentation and learn how to update Grafana Alerting.
Grafana Alerting upgrade: rule preview
Generally available in all editions of Grafana
Users looking to migrate from legacy alerting to Grafana Alerting can do so with confidence with the migration preview tool. The Grafana Alerting migration preview tool allows users to view, edit, and delete migrated rules, all as a test before cutting over to Grafana Alerting.
Check out our documentation for more information.
Also note: If you haven’t already upgraded to Grafana Alerting from legacy alerting, Grafana will initiate a dry run of the upgrade every time the instance starts. The dry-run logs the results of the upgrade attempt and identifies any issues requiring attention before you can successfully execute the upgrade. No changes are made during the dry run.
You can disable this behavior using the feature flag alertingUpgradeDryrunOnStart.
Simplified alert notification routing
Generally available in all editions of Grafana
This feature simplifies your options for configuring where your notifications are sent when an alert rule fires. You can choose an existing contact point from within the alert rule creation form (read: no more label matching for notification policies!). You can also set optional muting, grouping, and timing settings within the alert rule.

Simplified routing also inherits the alert rule RBAC, increasing control over notification routing while preventing accidental notification policy updates and ensuring critical notifications aren’t missed.
To try out Simplified Alert Notification Routing, enable the alertingSimplifiedRouting feature toggle.
🔌 New Grafana plugin: SurrealDB
Experimental in all editions of Grafana
SurrealDB data source has been added to the Plugin Catalog, enabling the integration of SurrealDB, a real-time, multi-model database, with Grafana’s visualization capabilities. This new data source plugin allows users to directly query and visualize data from SurrealDB within Grafana, using SurrealDB’s query language.

The SurrealDB data source launches with just the basics today. You can write queries in SurrealQL using the built-in query editor, although many Grafana features like macros are not supported for now.
You can find more information and how to configure the plugin on GitHub. You can also check out our documentation and our recent blog post.
🔐Authentication and authorization
Easier configuration for OAuth providers
Public preview in all editions of Grafana

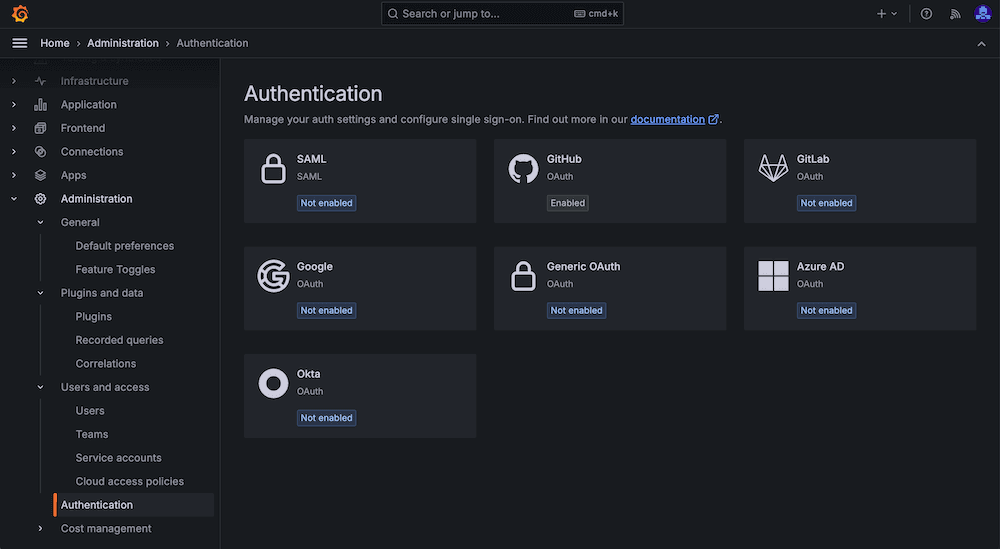
Configuring OAuth providers and setting up SSO for your instance just got easier.
We are introducing self-serve configuration options for OAuth in Grafana. All of the currently supported OAuth providers are now available for configuration through SSO settings in the Grafana UI, Terraform, and via the API. From the UI, you can also now manage all of the settings for the Generic OAuth provider.
AngularJS deprecation in Grafana: How to prepare
AngularJS support in Grafana was deprecated in Grafana 9 and it will be turned off by default in Grafana 11. When this happens, any plugin that depends on AngularJS will not load, and dashboard panels will not show data.
To help with this transition, Grafana now displays a warning banner in any dashboard with a dependency on an AngularJS plugin. Warning icons are also present in any panel where the panel plugin or underlying data source plugin has an AngularJS dependency.
This complements the existing warnings already present on the Plugins page under the administration menu.
We’ve also developed an open source tool to detect-angular-dashboards. It can be run against any Grafana instance to generate a report listing all dashboards that have an AngularJS plugin dependency, as well as which plugins are in use. The tool also can also detect private plugins that have an AngularJS dependency; however, this particular feature only works with Grafana 10.1 or higher.
To avoid any interruptions in your Grafana dashboards, we encourage you to migrate to React-based visualizations and data sources included in Grafana or from the Grafana plugins catalog.
To learn more, refer to the Angular support deprecation documentation, which includes recommended alternative plugins.
Learn more about Grafana 10.4
For an in-depth list of all the new features in Grafana 10.4, check out our Grafana documentation, the Grafana changelog, or our What’s New documentation.
Join the Grafana Labs community
We invite you to engage with the Grafana Labs community forums. Share your experiences with the new features, discuss best practices, and explore creative ways to integrate these updates into your workflows. Your insights and use cases are invaluable in enriching the Grafana ecosystem.
Upgrade to Grafana 10.4
Download Grafana 10.4 today or experience all the new features by signing up for Grafana Cloud, which offers an actually useful forever-free tier and plans for every use case. Sign up for a free Grafana Cloud account today.
Our Grafana upgrade guide also provides step-by-step instructions for those looking to upgrade from an earlier version to ensure a smooth transition.
A special thanks to our community
We extend our heartfelt gratitude to the Grafana community!
Your contributions, ranging from pull requests to valuable feedback, are crucial in continually enhancing Grafana. And your enthusiasm and dedication inspire us at Grafana Labs to persistently innovate and elevate the Grafana platform.
Grafana Cloud is the easiest way to get started with metrics, logs, traces, dashboards, and more. We have a generous forever-free tier and plans for every use case. Sign up for free now!

