
Why implementing Grafana Enterprise was a bright idea for U.K. energy supplier Utilita
Energy efficiency is a term often used to describe appliances or light bulbs. But when it comes to business, making sure your sales team — and customers — are being efficient with their personal energy is a big key to success.
That was a major lesson learned by Utilita, the U.K.’s first and only specialist Smart Pay As You Go Energy supplier. By using Grafana Enterprise — and its array of enterprise features and plugins — to monitor sales, payment, and customer support, they’ve saved time and money, and been able to pass savings (and useful information) along to their customers.
They were turned on to Grafana in 2019, and implementing it as a company-wide monitoring and visibility solution was simple. Because they’re an Oracle-based company, the Oracle plugin made it easy, says Adrian Goater, Utilita’s Web Development Manager.
He says Utilita uses Grafana “quite heavily” now, and one of the things they’ve come to rely on is alerting. It’s become an especially important tool as they grow their business and acquire more customers.
One big problem Grafana solved was in the customer sign-up process. In the past, Utilita often wouldn’t find out that a potential new customer was ineligible for service until after they had signed up online. It led to lost money and wasted resources. Now, they have a dashboard that lets them monitor the sign-up process in real-time.
The team has discovered a lot of other uses for Grafana alerting, too. For instance, one of their most-used dashboards lets them know when a customer starts the process to top up their payment card but stops prior to completion. They also use dashboard maps so they can see — and begin fixing — power outages before customers start calling.
Enhanced customer experience
Utilita has expanded their use of Grafana from just a monitoring tool to something that enhances a customer’s overall experience as well.
A new feature they’re developing is predictive appliance usage. Currently still in beta, it starts with a customer filling out a survey to share how many people are living in the home and what appliances they have.
The data is displayed in a Grafana dashboard and shows how much energy they’re consuming. “Once we know more about their appliances and energy consumption, we are able to offer them more accurate energy efficiency advice,” Goater explains.
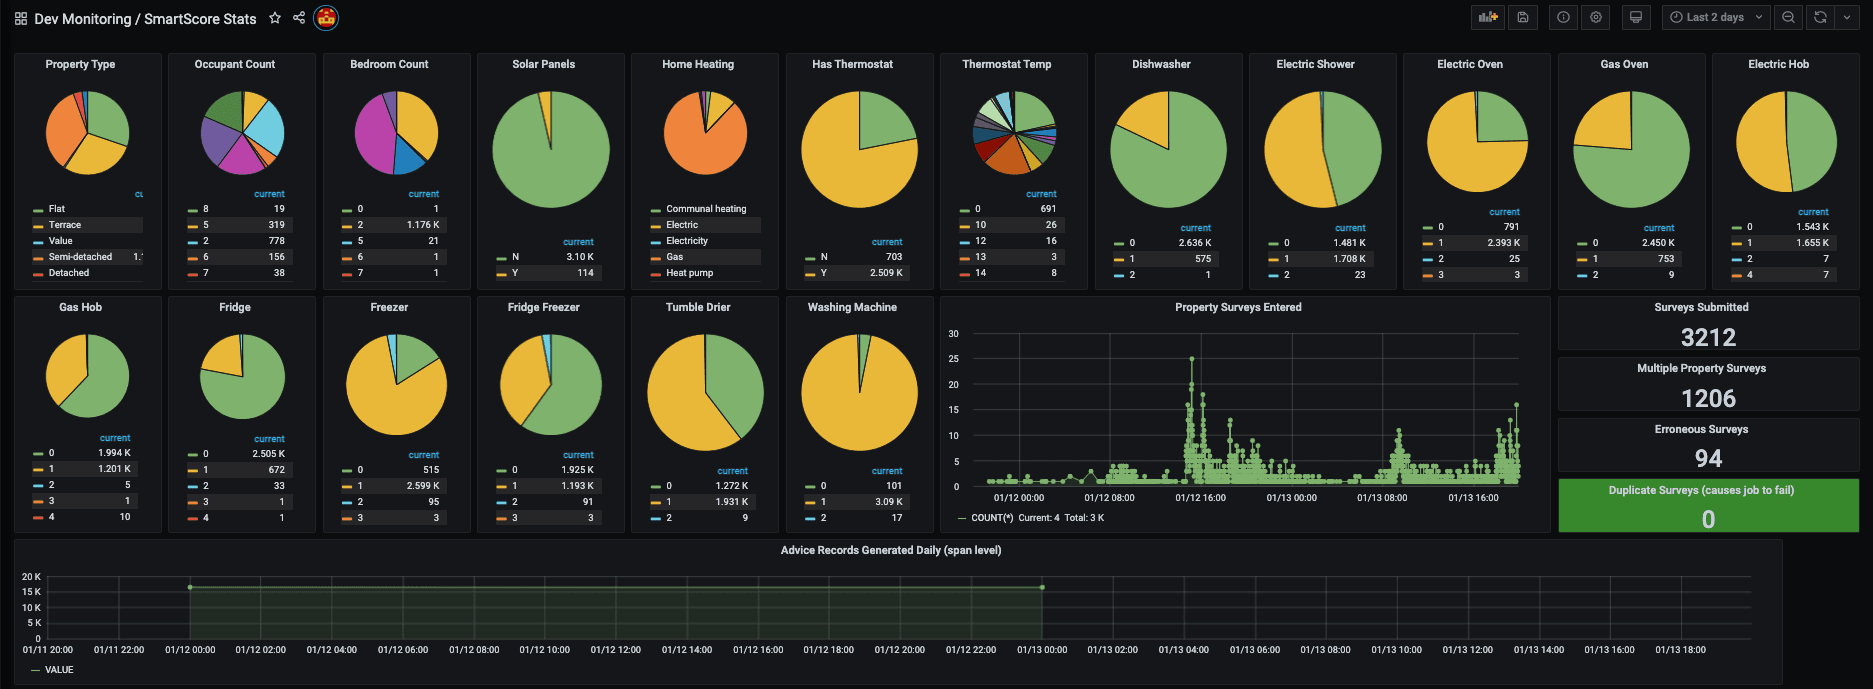
Internal dashboard showing a Utilita customer’s individual appliances and how much energy they’re consuming
With Grafana in their tech toolbox, Utilita is continuing to explore different ways they can use metrics to create new features.
“Thanks to Grafana,” Goater says, “we’re in a position now where we can add additional tech — digital products — quickly and efficiently, with very low additional cost to the business.”
To learn more about Utilita’s use of Grafana Enterprise, check out their full success story here.
We recently introduced the Grafana Enterprise Stack, our self-managed observability stack tailored for enterprises. Read more about the offering here, and contact us if you’d like to try it out!

