Monitoring high-throughput real-time telemetry data at Daimler Truck with the Grafana Stack
To offer its customers state-of-the art digital services, Daimler Truck manages anonymized data from more than 8,000 connected buses operating in Europe using the cTP, an installed piece of technology that streams telemetry data (such as vehicle speed, GPS position, acceleration values, and braking force). The throughput going through the system is around 300k messages per second, or around 7MB at peak, on an average latency of around 5 seconds between the vehicle and when the data is available for consumption.
This entire trove of data requires services that ingest, store, process, analyze, and feed connectivity services (such as fleet management systems, vehicle insights, and driver grading).
These services run in a Kubernetes environment and are monitored in near real-time via a stack of Grafana, Grafana Loki, Prometheus (leveraging Grafana Mimir), and Pyrra. Needless to say, all of these services need to have availability as high as possible, and their own response and throughput latencies have to be as low as possible.
In this session, Principal Engineer of tb.lx by Daimler Truck, Adrien Bestel, will demonstrate how they run in three environments (dev / int / prod), with three separate Grafana instances, and have automations in place using the Grafana APIs that synchronize their dashboards and promote them between environments. On top of that, they’ll talk about how they use SLI and SLO metrics from within Grafana itself in order to track the team’s uptimes and service levels and give visibility to downstream teams that might be interested in this information.
- Adrien Bestel
Principal Engineer at tb.lx by Daimler Truck

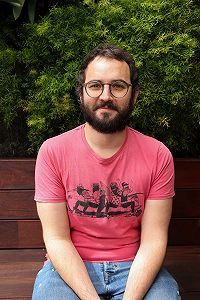
Adrien Bestel
Principal Engineer at tb.lx by Daimler Truck
Originally from France, Lisbon-based Adrien Bastel currently works as a Principal Engineer at tb.lx, a Digital Product Studio for Daimler Truck, with a focus on operations. He loves functional programming and when not in front of a computer, Adrien loves to cook.
GrafanaCON Local Meetup Events