
今後のライブウェビナー
本物の専門家によるリアルタイムの洞察。


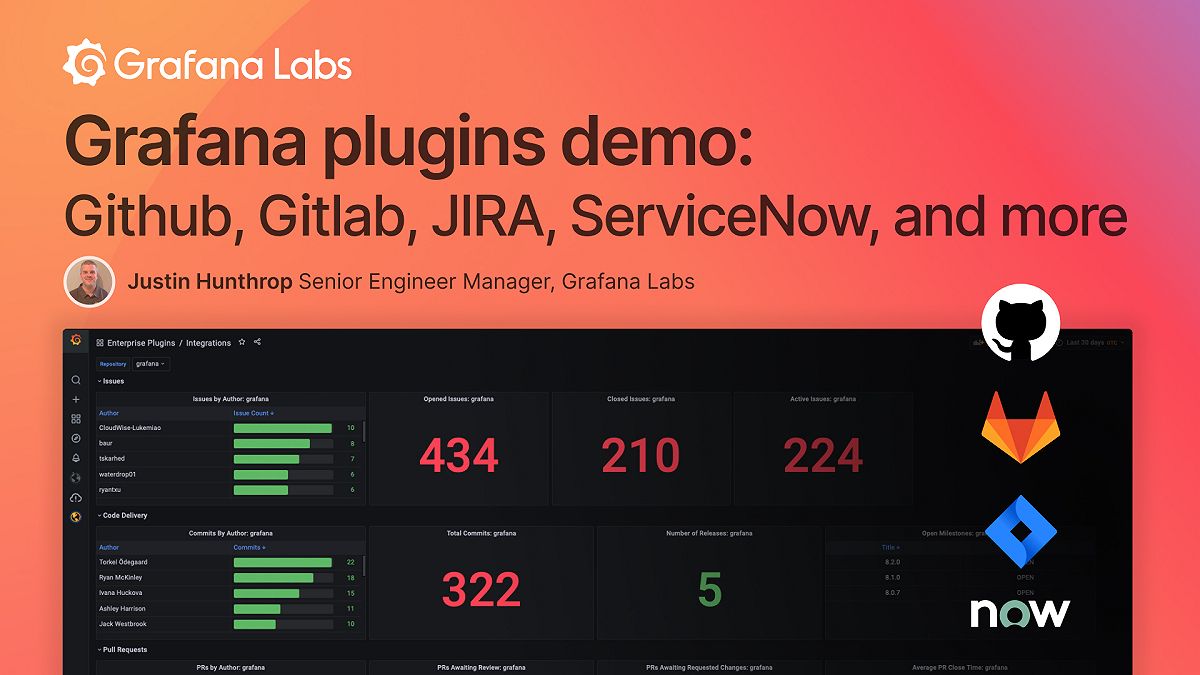
オンデマンドビデオ
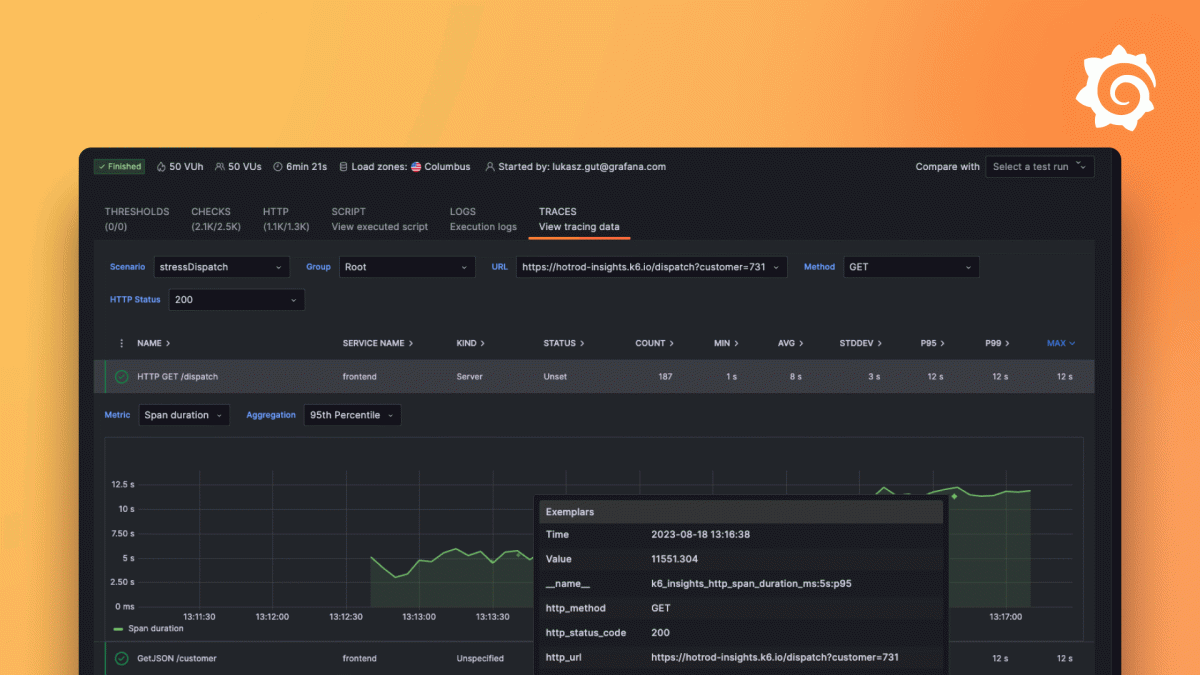
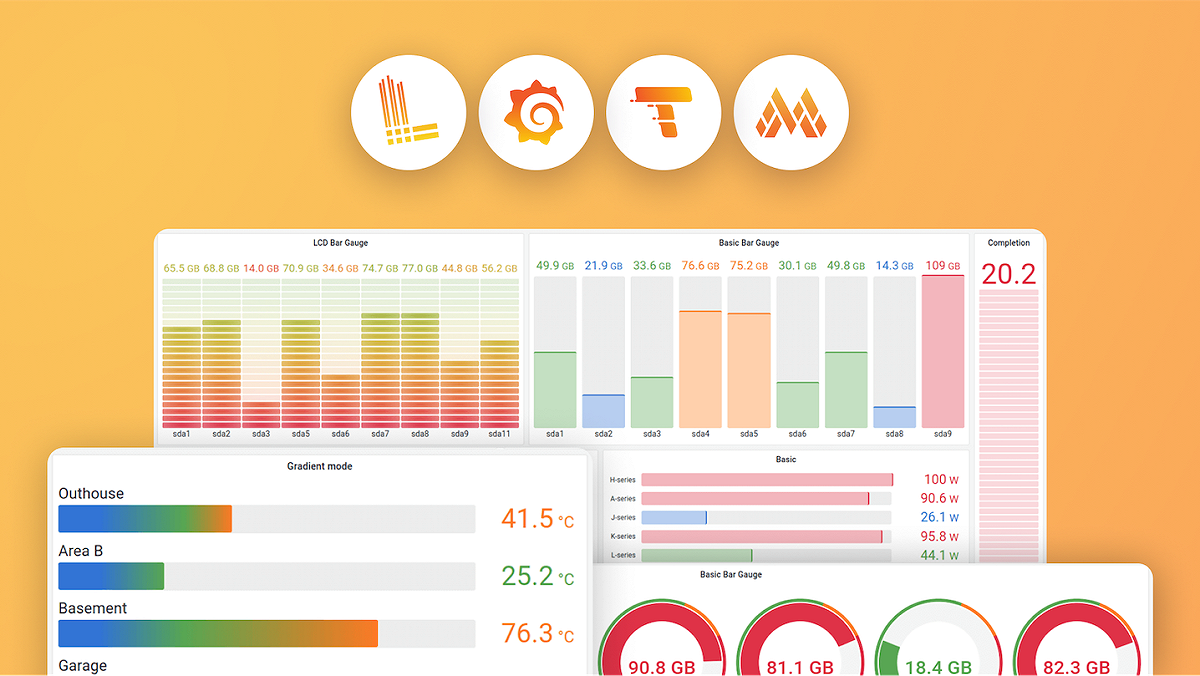
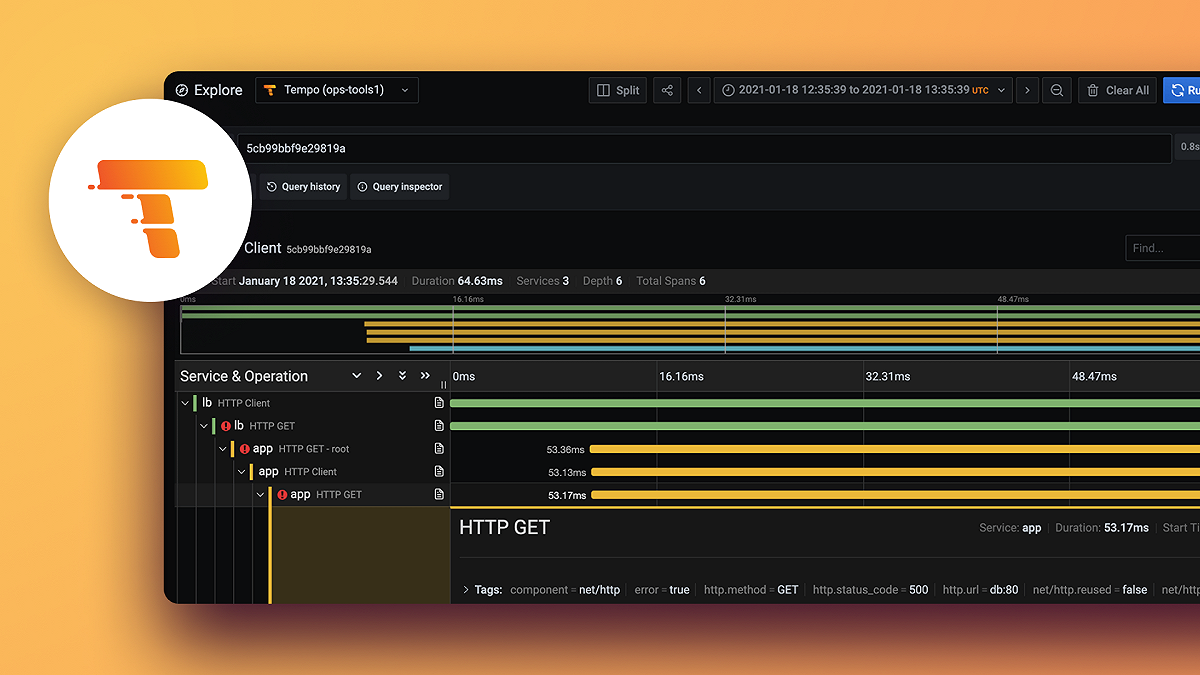
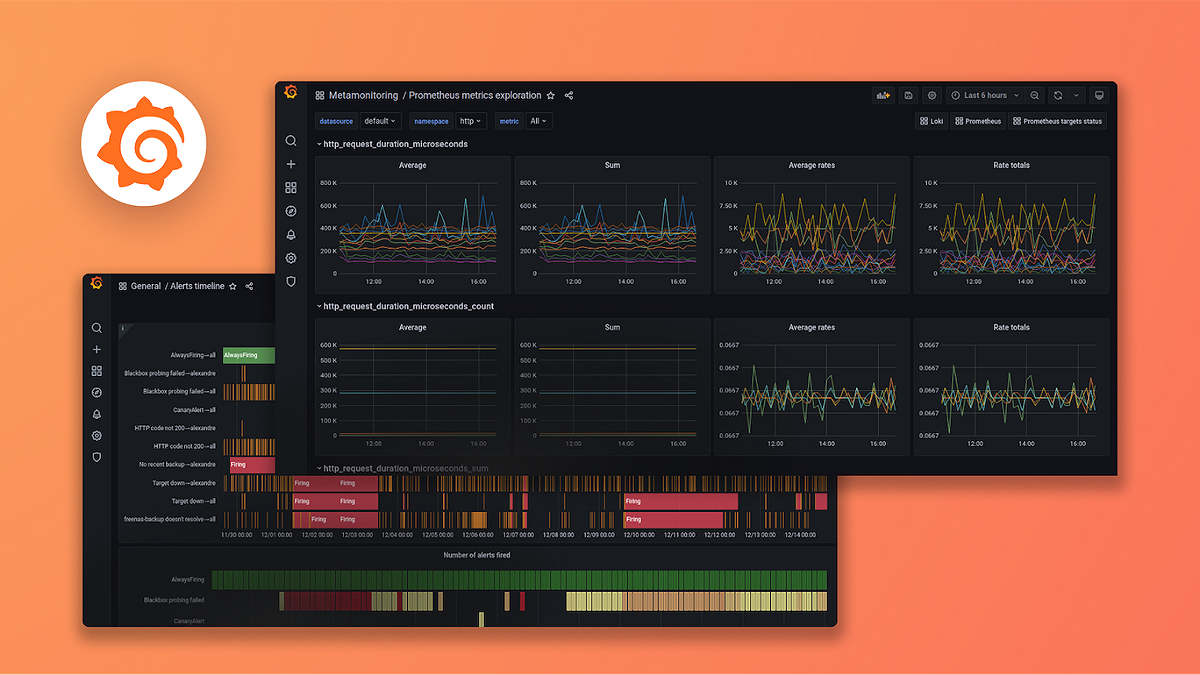
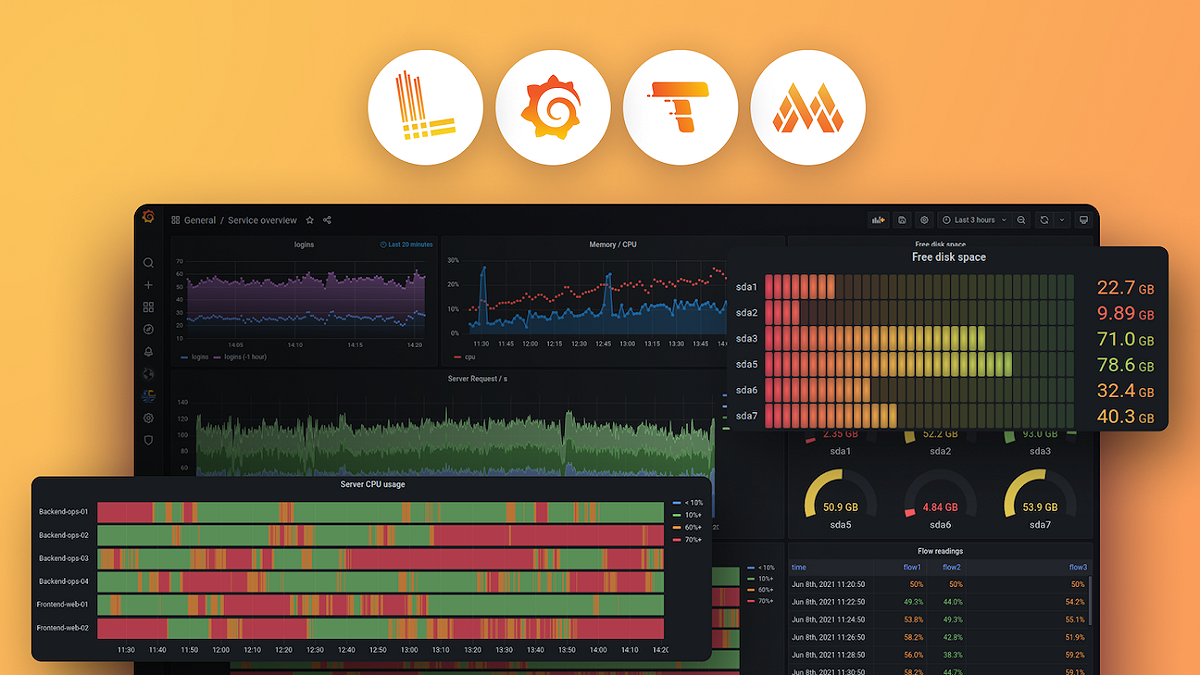
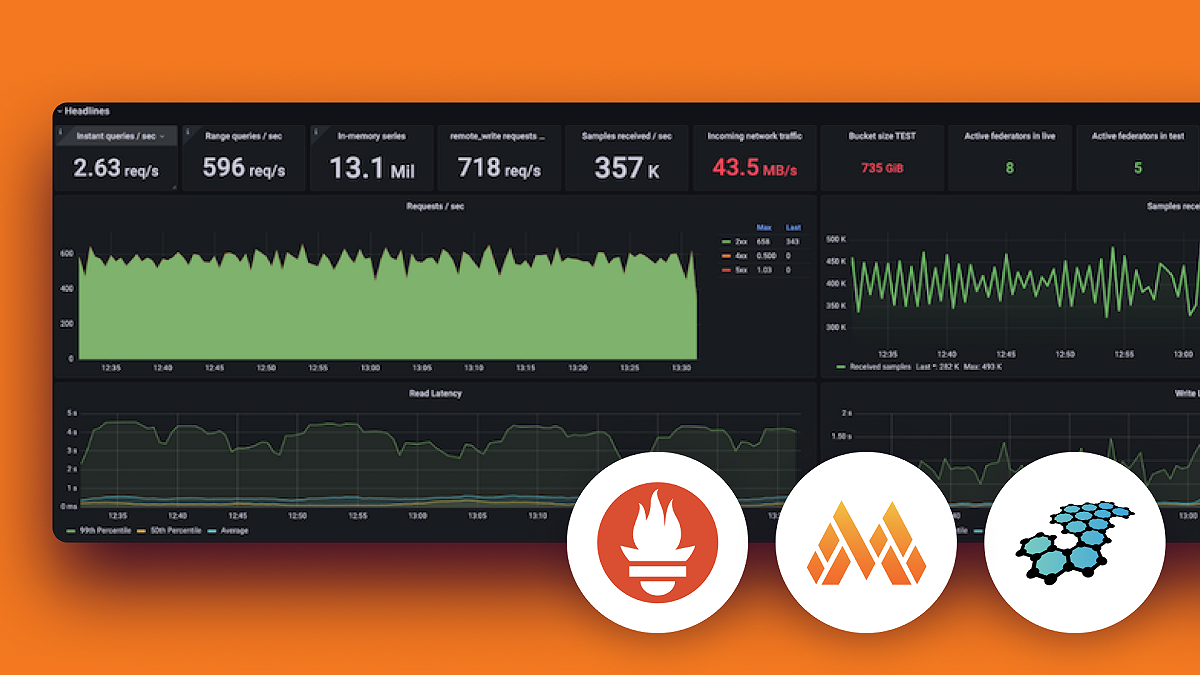
フィルターを使用するか、スクロールして LGTM スタックの詳細を確認してください。
今後のライブウェビナー
本物の専門家によるリアルタイムの洞察。
すべてのビデオとウェビナー
フィルターを使用するか、スクロールして LGTM スタックの詳細を確認してください
結果がありません。1つ以上のフィルターを解除してください。
ビデオを探す
フィルター条件
製品
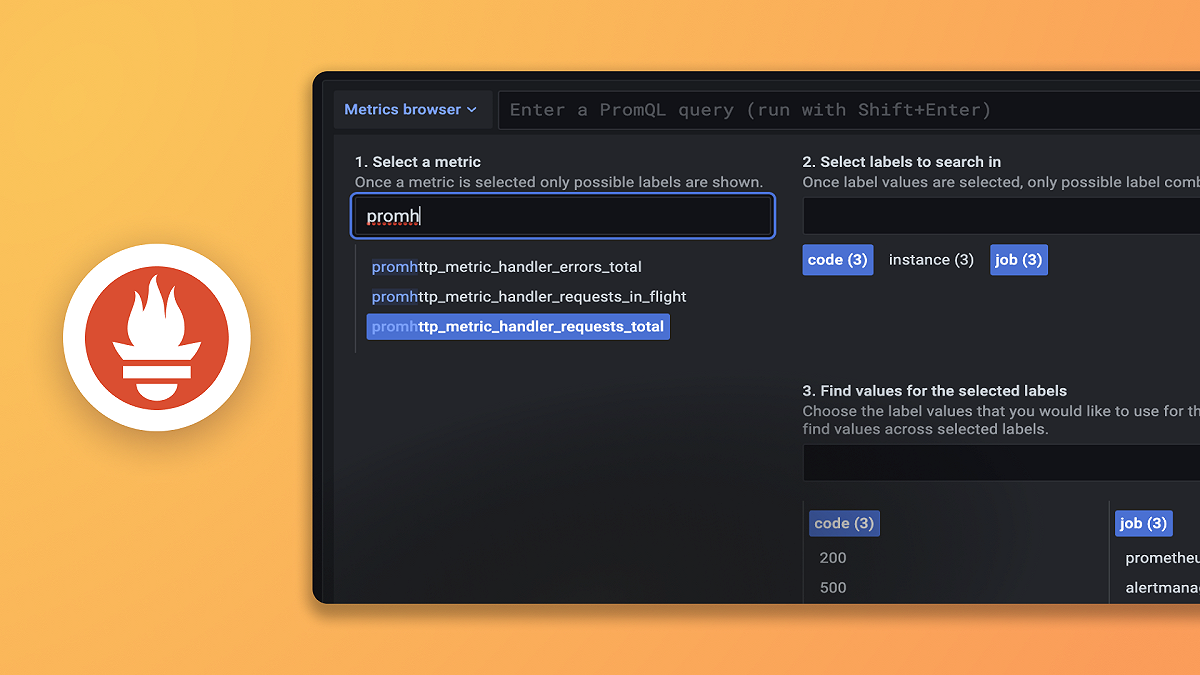
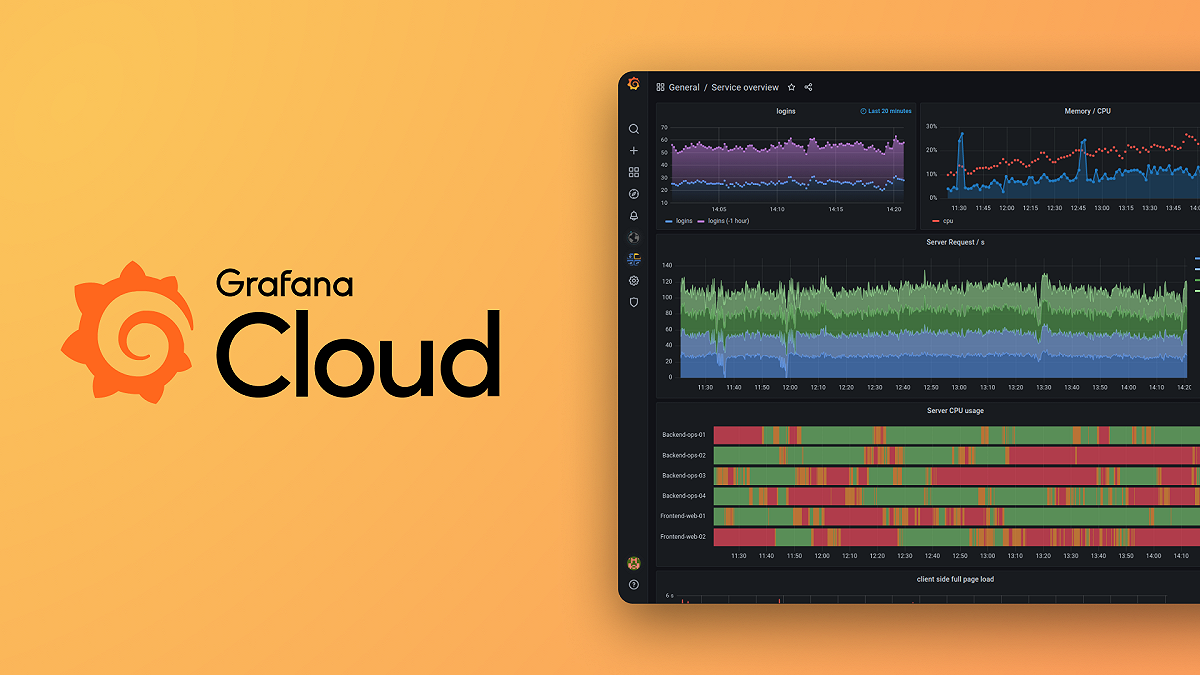
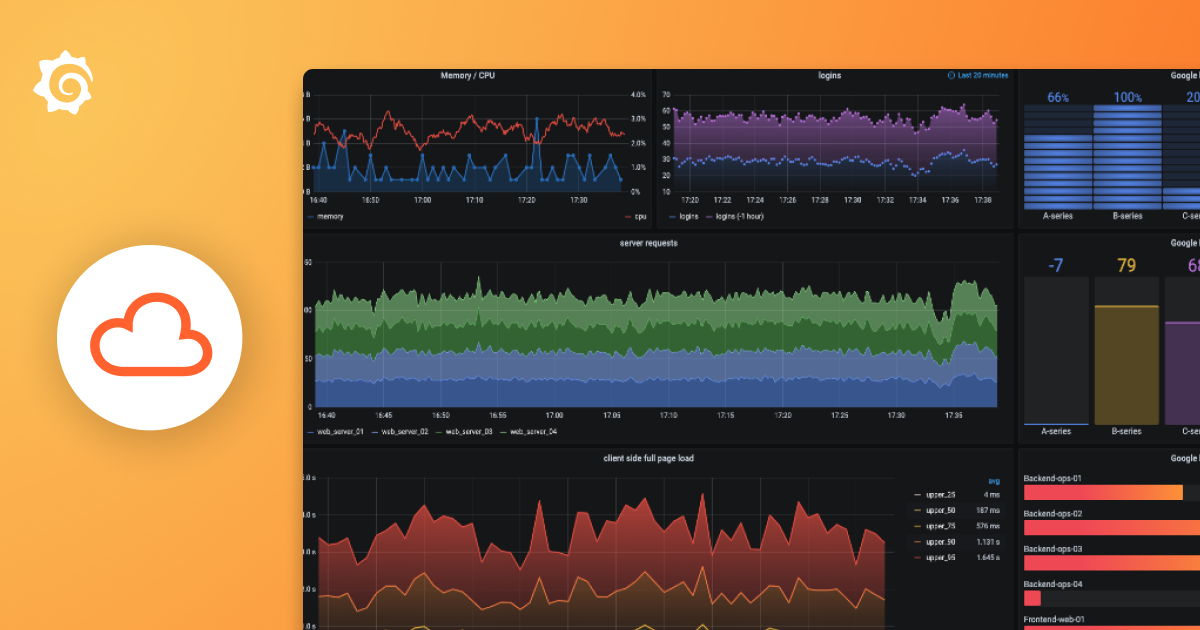
Grafana Cloud
AIを活用したオブザーバビリティで、監視、分析、対応を迅速化します。
LGTM+スタック
主要な機能
エンドツーエンドソリューション
より簡単に、より迅速に目的を達成するための、実用的なソリューション
インフラストラクチャの監視
オブザーバビリティのための、すぐに使えるKPI、ダッシュボード、アラート
あらゆるデータの可視化
すべてのデータソースを即座にGrafanaへ接続
Grafana Cloud
実用的な無料プラン
Prometheusメトリクス: 10,000
ログ: 50GB, トレース: 50GB, プロファイル: 50GB
k6テスト: 500 VUh
Enterpriseデータソースプラグイン: 20以上
構築済みソリューション: 100以上
3 active AI users
すべてのデータソースを即座にGrafanaへ接続